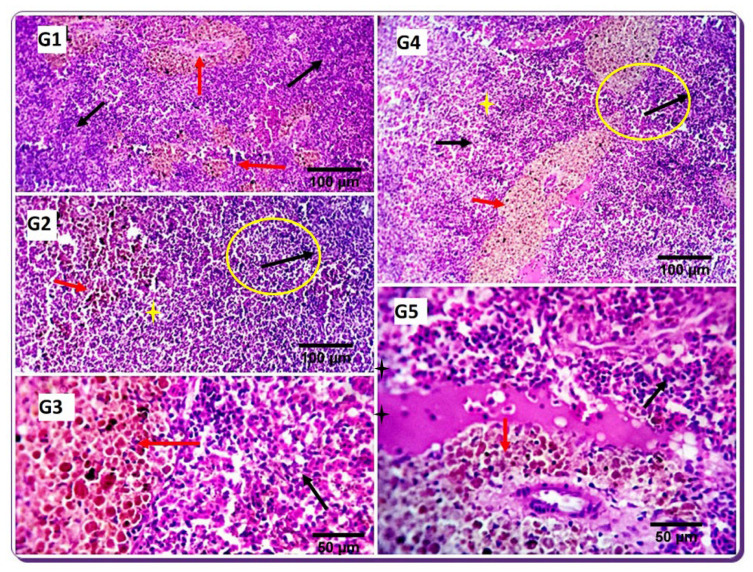
Figure 5.
Photomicrographs demonstrating the histomorphological structures in the spleen of control fish (1) and the spleen of treatment groups (2–5). The spleen of the control fish shows mild proliferative clusters of melanomacrophages (red arrows), and the white pulp comprising mainly lymphoid cells usually encircles small arterioles, occasionally assuming a nodular pattern (black arrows). The spleen of the treatment groups shows histomorphological structures similar to the control group. However, the lymphoid components formed clusters or different nodular arrangements mainly near the small blood vessels (yellow circles and black arrows), and the splenic cords (yellow stars) are outstanding, especially in groups 2 and 4 (black arrows). Moderately activated MM centers were observed in groups 3 and 4 (red arrows). Mild interstitial edema (black star) and mild to moderate melanomacrophage center activations (red arrow) were visible in G5. G1: SDBH0, G2: SDBH2.5, G3: SDBH5, G4: SDBH7.5, G5: SDBH10. H&E. scale bar 50 and 100 µm.

