
Figure 2. Unbiased CRISPRi screen with a tiling pgRNA library identified essential enhancers around MYC and MYB oncogenes in 10 human cancer cell lines.
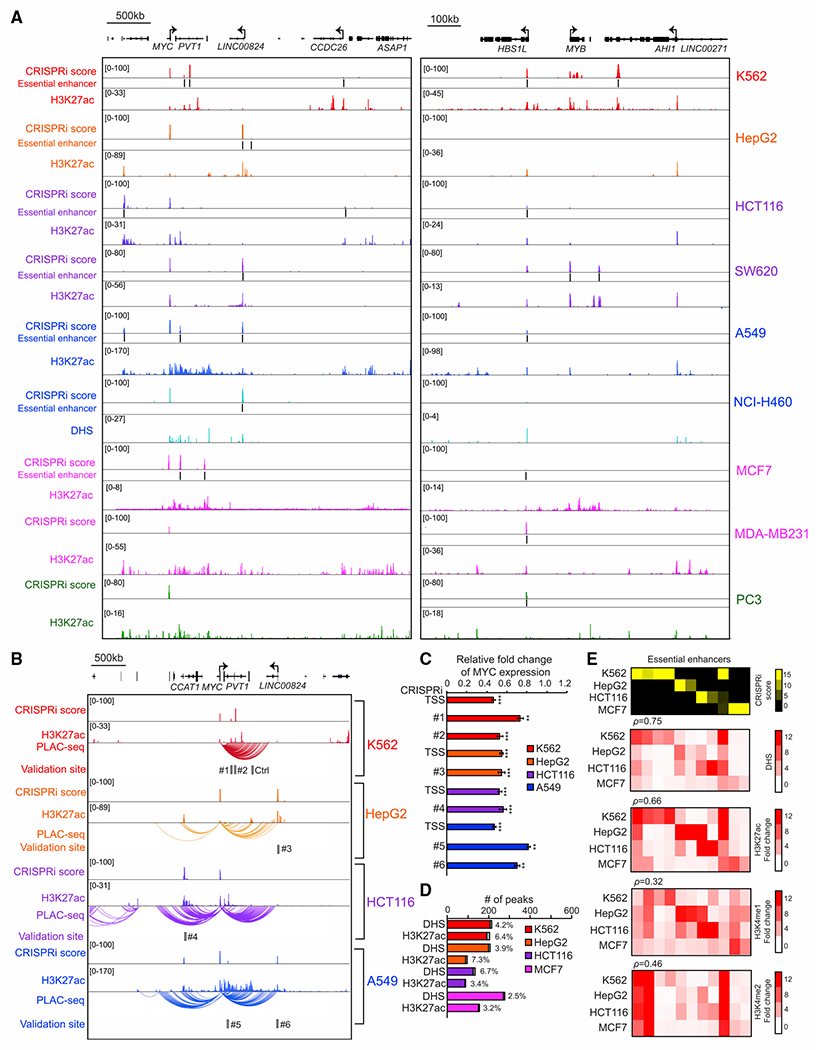
(A) The genome browser snapshot shows CRISPRi score (top), essential enhancers, and H3K27ac ChIP-seq signal, H3K27ac (middle), or DNase signal, DHS (bottom), from the indicated cell lines.
(B) Chromatin interactions identified by H3K4me3 PLAC-seq at the MYC locus across four different cancer cell lines. The gray box represents the selected genomic region for further validation.
(C) Gene expression measurement of the MYC gene by qRT-PCR after silencing the selected essential enhancers by CRISPRi in various cell lines (red, K562; orange, HepG2; purple, HCT116; blue, A549). Relative fold changes represent the ratios of gene expression from the CRISPRi silenced essential enhancer to the control samples. Data shown are mean ± SD from three biological replicates performed. p values were determined by a two-tailed Student’s t test after silencing individual enhancer compared with control cells (**p < 0.01, ***p < 0.001).
(D) The percentage of DHS or H3K27ac peaks that overlapped with essential enhancers from indicated cell lines. Gray bars indicate the number of DHS or H3K27ac peaks overlapped with essential enhancers (red, K562; orange, HepG2; purple, HCT116; blue, A549; pink, MCF7).
(E) Correlation between enhancer features (chromatin accessibility and histone modifications) and the function of essential enhancers across different cell types. The heatmap represents the chromatin accessibility and the signals of active enhancer marks across various cell lines. Each row represents the signal from the indicated dataset in each cell line and each column represents individual essential enhancers identified from the CRISPRi-pgRNA screen.