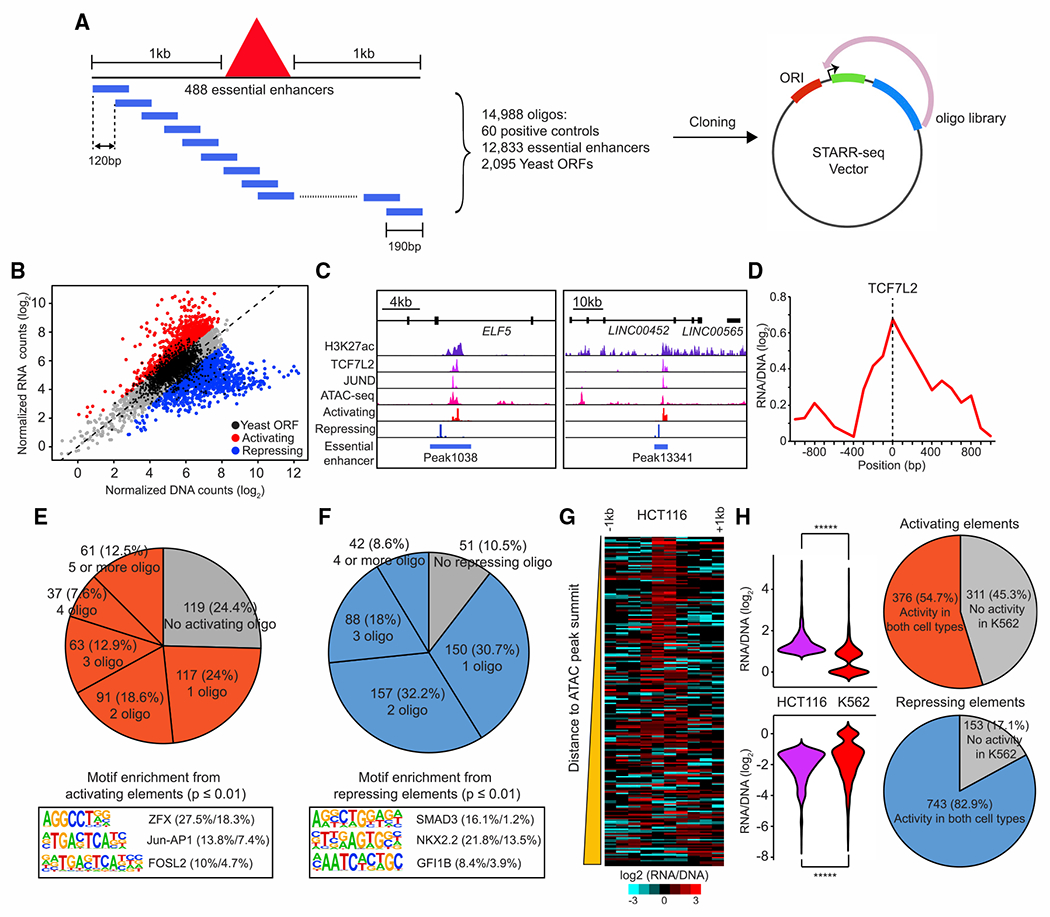
Figure 4. Dissection of regulatory elements within the essential enhancers.

(A) A schematic diagram represents the design of a tiling-based STARR-seq library to test the enhancer activity of DNA elements within the 488 essential enhancers identified in HCT116 cells.
(B) Identification of activating or repressing DNA fragments within essential enhancers. Oligonucleotides with significant enhancer activities are labeled as red and oligonucleotides with significant repressive activities are shown as blue (empirical FDR < 0.05). An empirical FDR of 5%, calculated based on the rate of enriched negative control yeast oligonucleotides, was used to determine the activating and repressive elements (Yan et al., 2021).
(C) Examples of activating and repressing elements within the same essential enhancer. Genome browser snapshot shows the signals of active elements from STARR-seq overlapped with ChIP-seq signals of H3K27ac, TCF7L2, and JUND at accessible genomic regions while the signals of repressive elements are enriched in inaccessible chromatin regions at two representative essential enhancers.
(D) Aggregated plot shows enrichment of activating elements centered at the peak of TCF7L2 binding sites. A total of 125 TCF7L2 peaks overlapped with essential enhancers was used in this analysis.
(E and F) Top: the percentage of activating (E) and repressing (F) elements found in essential enhancers. Bottom: the top 3 enriched motifs associated with activating (E) and repressing (F) elements identified by HOMER are shown (Heinz et al., 2010). The percentage of enriched motifs from the foreground and background groups is shown nextto each motif. The foreground group contains genomic sequences with activating or repressing elements and the background group contains genomic sequences 1 kb up or downstream of the corresponding 488 essential enhancers. p values were determined using a hypergeometric test.
(G) Distribution of activating and repressing elements within the essential enhancers. The heatmap shows the enrichment of activating (left) or repressing (right) signals comprising the 1 kb surrounding the summit of ATAC-seq peaks overlapped with 488 essential enhancers. The essential enhancers are sorted from nearest to farthest according to the genomic distance of the activating elements to the summits of 229 ATAC-seq peaks overlapped with them.
(H) Comparison of the activity of activating (n = 687) and repressing elements (n = 896) between HCT116 and K562. p values were determined by the two-sided Wilcoxon test (*****p < 0.00001).
