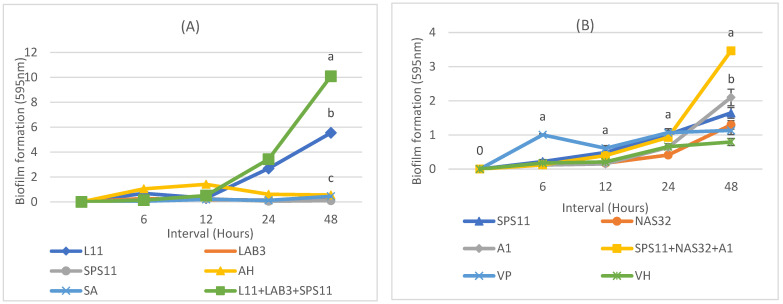
Figure 3.
(A) Comparison of biofilm formation for SSPs (L11, LAB3, and SPS11) and MSP1 (L11 + LAB3 + SPS11) with A. hydrophila and S. agalactiae. (B) Comparison of biofilm formation for SSP (SPS11, NAS32, and A1), MSP (SPS11 + NAS32 + A1) with pathogen V. parahaemolyticus and V. harveyi. Biofilm formation was measured at intervals of 6, 12, 24, and 48 h. Different alphabets indicate significant differences among treatments (p < 0.05).

