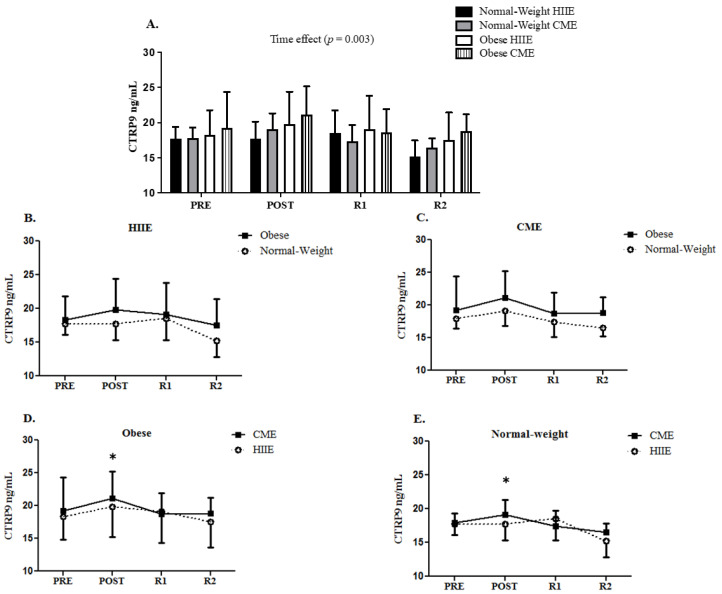
Figure 1.
The response of serum CTRP9 following HIIE vs. CME in normal-weight and obese participants (panel (A)). The CTRP9 response to HIIE in normal-weight and obese participants (panel (B)). The CTRP9 response to CME in normal-weight and obese participants (panel (C)). The comparison of CTRP9 response to CME vs. HIIE in obese participants (panel (D)). The comparison of CTRP9 response to CME vs. HIIE in normal-weight participants (panel (E)). Data are presented as means ± SD. * Time effect vs. PRE.

