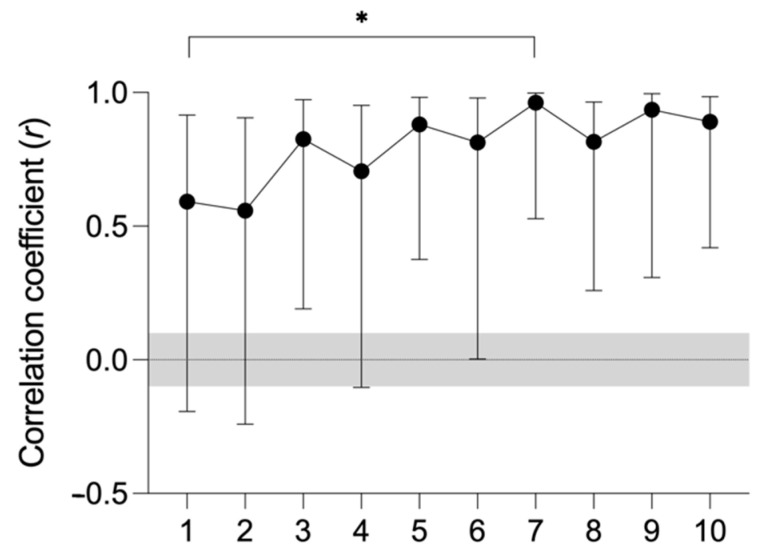
Figure 3.
List of the values for RPE (rate of perceived exertion) and HR (mean heart rate) recorded in the different matches. The bars indicate uncertainty in correlation coefficients with 90% confidence intervals. The shaded area indicates the trivial effect size value. * p < 0.10: different from match 1.

