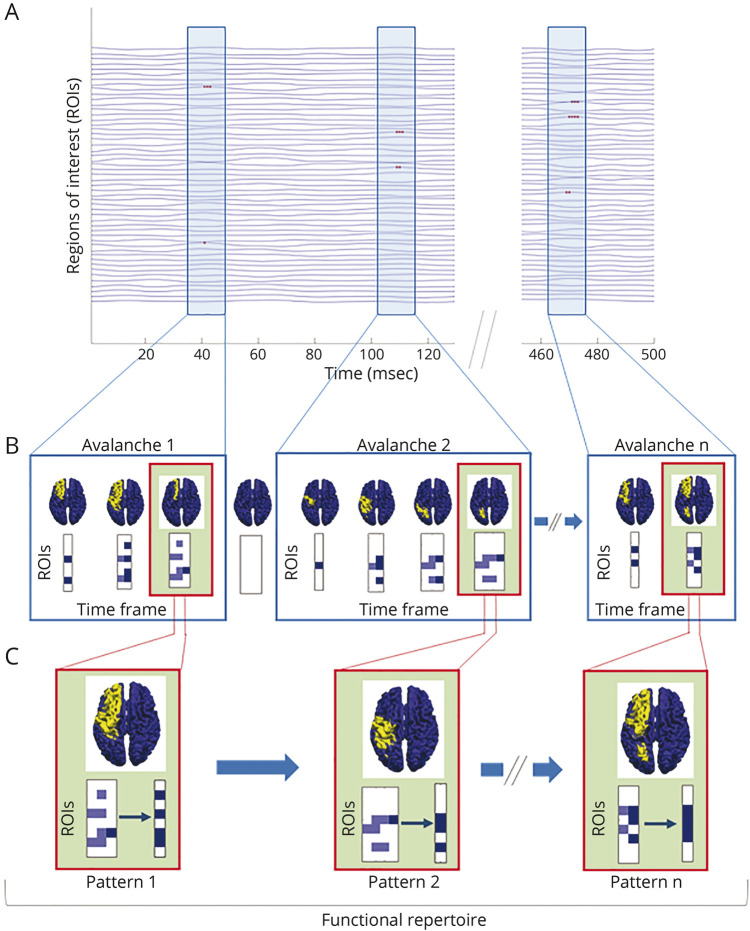
Figure 1. Schematic Representation of Neuronal Avalanches and Functional Repertoire.
(A) Source-reconstructed time series. Light blue rectangles represent the time frames in which neuronal avalanches occur; red dots in the rectangles denote activated brain regions (signal above the threshold) in a time interval (msec). (B) In the boxes, avalanche patterns of 3 different neuronal avalanches are illustrated (for clarity, the avalanches reported last up to 4 time frames). An avalanche is defined as an event that begins when at least 1 brain region deviates from its baseline activity (above the threshold) and ends when all regions display a typical level of activity (below the threshold). Given a neuronal avalanche, its corresponding pattern is the set of all the brain areas that were recruited at any time. The brain plots for each time frame of an avalanche show the areas above (yellow) and below (blue) the threshold. Each matrix represents an avalanche pattern: dark blue squares indicate the brain regions (ROIs) activated at a certain time frame, while the light blue ones are all the regions that have been activated up to that moment. (C) In the green boxes, for each of the above avalanches, the brain plot and the set of unique avalanche patterns are illustrated. Unique means that each avalanche pattern only counts once toward the size of the functional repertoire. The number of unique avalanche patterns defines the size of the functional repertoire and is used as a proxy for the flexibility of the brain dynamics.

