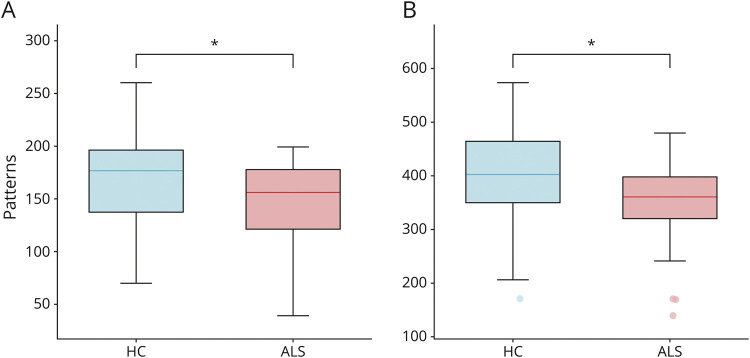
Figure 2. Comparison of the Number of Unique Avalanche Patterns.
Box plots illustrating the differences in the size of the functional repertoire in healthy controls (HC) and patients with ALS (ALS), in delta (A) and theta (B) frequency bands. The central mark in the box indicates the median, the edges of the box the 25th and 75th percentiles, and the whiskers extend to the 10th and 90th percentiles. The outliers are plotted individually using dots. Significance p-value: *p < 0.05, corrected. The figure was made using Matlab 2019a. ALS = amyotrophic lateral sclerosis.

