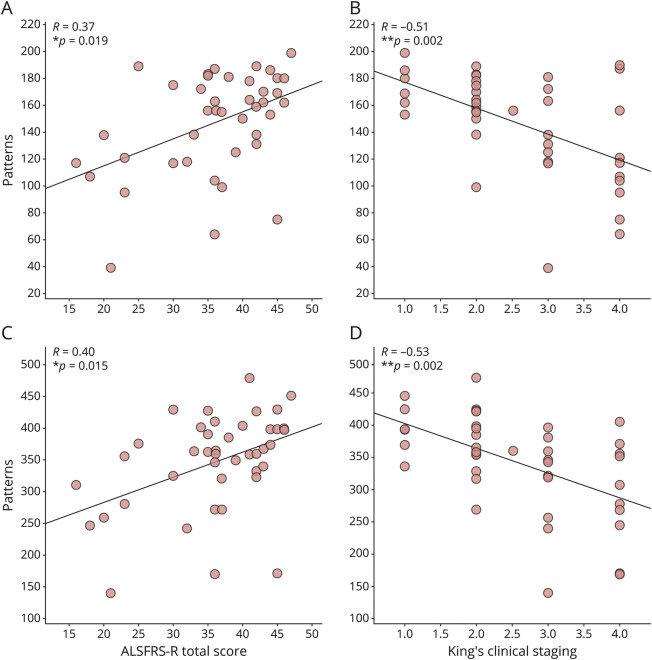
Figure 4. Relationship Between Brain Dynamics and Clinical Features in the ALS Group in the Delta (A and B) and the Theta (C and D) Frequency Bands.
(A) Positive correlation between the number of unique avalanche patterns and the ALSFRS-R (R = 0.37, p = 0.019) and (B) negative correlation between the number of patterns and the King's clinical staging system (R = −0.51, p = 0.002) in the delta band; (C) Positive correlation between the number of unique avalanche patterns and the ALSFRS-R (R = 0.40, p = 0.015) and (D) negative correlation between the number of patterns and the King's clinical staging system (R = −0.53, p = 0.002) in the theta band. The Spearman correlation coefficient was used, and the results were corrected by false discovery rate (FDR) correction. Significance p-values: *p < 0.05, **p < 0.01. The figure was made using Matlab 2019a. ALS = amyotrophic lateral sclerosis.

