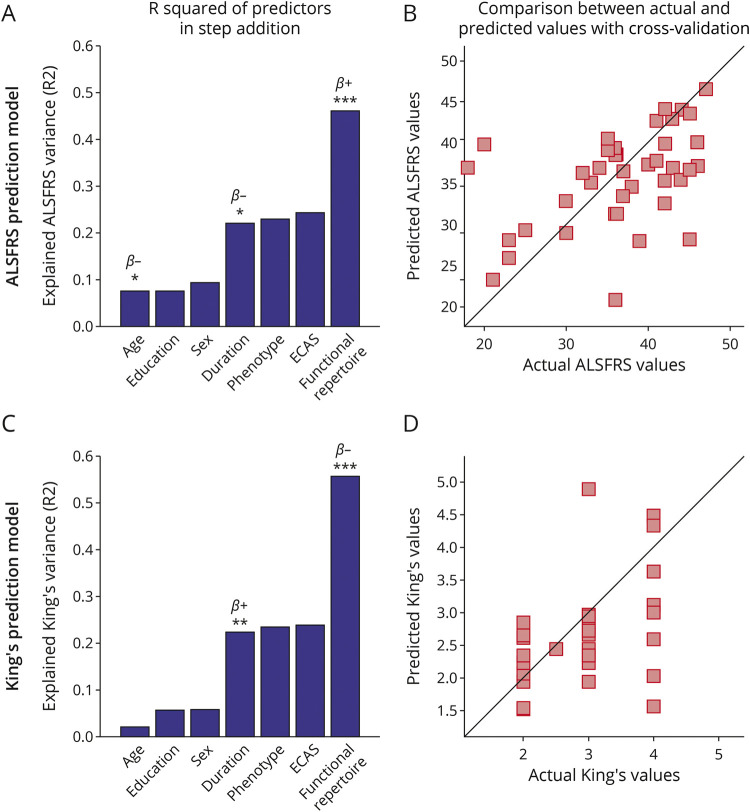
Figure 5. Multilinear Model With k-Fold Cross-validation in the Delta Frequency Band.
Using as predictors age, education, sex, disease duration, ALS phenotype, ECAS, and the size of the functional repertoire, the model predicts (A and B) the ALSFRS-R (age: p = 0.038, β = −0.23; disease duration: p = 0.020, β = −0.05; functional repertoire: p < 0.001, β = 0.11); (C and D) the King's clinical staging system (disease duration: p < 0.01, β = 0.01; functional repertoire: p < 0.001, β = −0.02). In (A and C), the explained variance of the variable to be predicted as a function of the predictors is illustrated. Significant predictors are indicated by asterisks; positive and negative coefficients are illustrated with β+ and β−, respectively; significance p-values: *p < 0.05, **p < 0.01, ***p < 0.001. In (B and D), scatter plots of the comparison between actual and predicted values are reported. The figure was made using Matlab 2019a. ALS = myotrophic lateral sclerosis; ECAS = Edinburgh Cognitive and Behavioural ALS Screen

