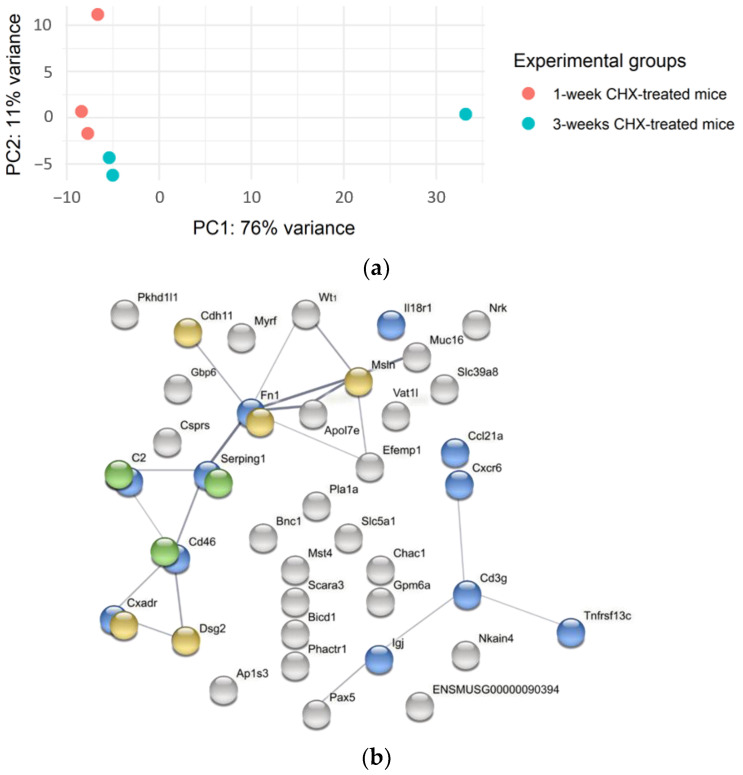
Figure 9.
Gene expression heterogeneity as shown by PCA and clustering by STRING analysis as obtained from RNA sequencing of the abdominal wall of CHX-treated mice. (a) Principal component analysis shows the heterogeneity of gene expression within the 1-week (red) and the 3-week (blue) CHX-treated mice. (b) STRING analysis of a network of upregulated, differentially expressed genes in the abdominal wall between 3-week and 1-week CHX-treated mice. Network nodes represent proteins, edges represent protein–protein associations, both functional and physical, and line thickness indicates the strength of data support (thicker lines—more support). The minimum required interaction score is 0.4. The nodes are colored based on significant functional enrichments among those proteins as the most relevant biological processes (according to Gene Ontology): blue—immune response and defense; yellow—adhesion-related; and green—complement.

