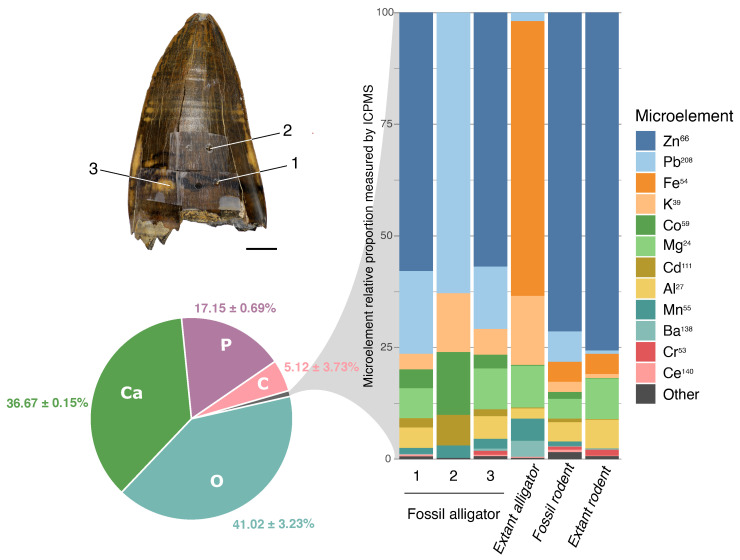
Figure 9.
Pie chart displaying the mean (±SD) of the major chemical macroelements (Ca, O, P, and C) found in the enamel (weight percent, wt%) of all samples analyzed by SEM-EDS in this study. On the right, the bar chart shows the proportion of microelements lower than 1% found in each sample (and determined by ICP-MS). In the bars, each element appears as a relative percentage based on the more abundant microelements determined by ICP-MS, except calcium. The picture on the upper left shows the three different enamel regions analyzed in the fossilized alligator (Purussaurus sp.) enamel: 1. The darkest enamel area; 2. The predominant brown color enamel; and 3. The yellow enamel area.

