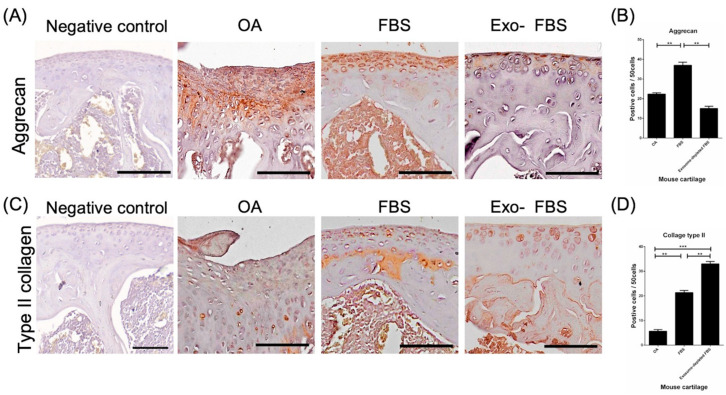
Figure 6.
Immunohistochemistry (IHC) of aggrecan and type II collagen in destructed cartilages of mice. (A) After 28 days of experiments, the representative image of aggrecan in normal cartilage (IHC negative control), normal saline control, and exosome +/− FBS-cultured HUCMSC-treated knees (n = 3 in each group). Scale bar = 100 μm. (B) Quantification of aggrecan expression in the three groups. ** p < 0.01. (C) Representative image of type II collagen in normal cartilage (IHC negative control), normal saline control, and exosome +/− FBS-cultured HUCMSC-treated knees (n = 3). Scale bar = 100 μm. (D) Quantification of type II collagen expression in the three groups. ** p < 0.01, *** p < 0.001. Representative results from 3 experiments. HUCMSCs were derived from the same donor.

