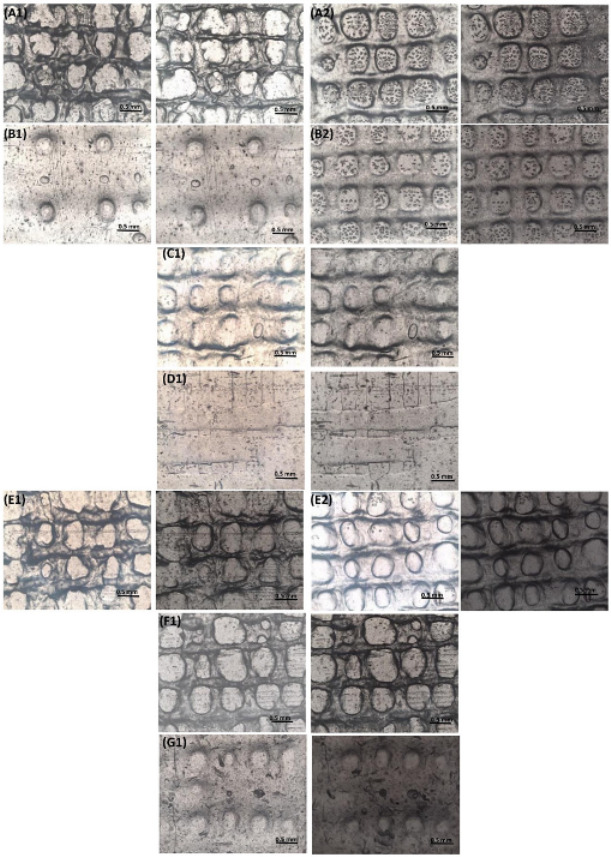
Figure 6.

Microscopic images of the meshes after printing (left for each group) and after vacuum drying (right of each group) of the formulations, scale bar = 0.5 mm (A) G, (B) GB0.5, (C) GB1, (D) GB2, (E) GS0.5, (F) GS1, and (G) GS2, where 1 refers to meshes printed with 25 G and 2 refers to those printed with 27 G needles.
