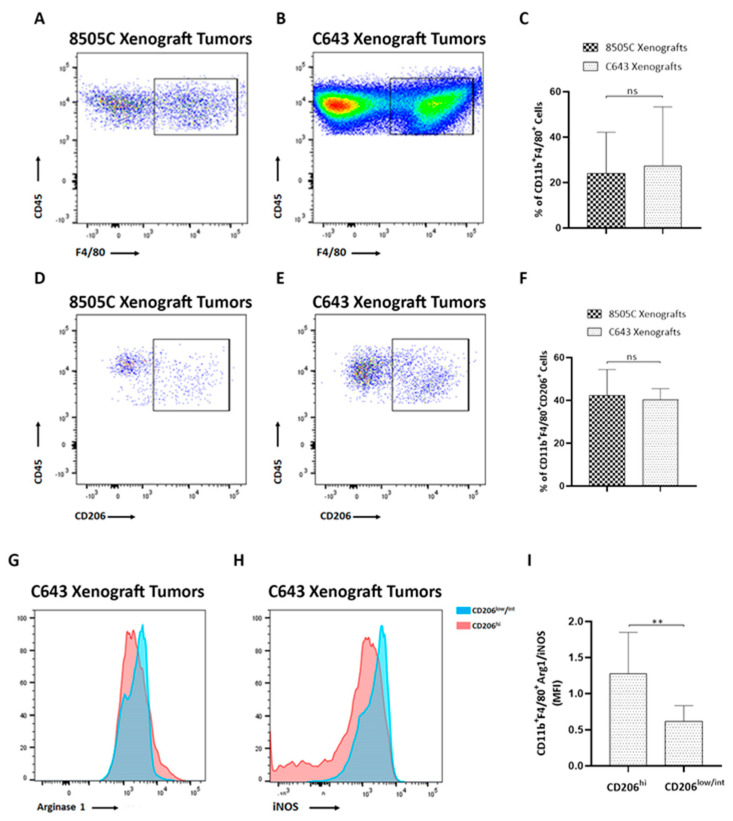
Figure 3.
M2-like macrophages were recruited to ATC xenograft tumors. (A,B) Representative FACS analysis of macrophages (CD11b+ F4/80+) out of all CD45+ cells infiltrating 8505C xenograft tumors (A) and C643 xenograft tumors (B). (C) Quantification of the percentage of CD11b+ F4/80+ cells (n = 8–10). (D,F) Representative FACS analysis of M2-macrophages (CD11b+ F4/80+ CD206+) out of all CD45+ cells infiltrating 8505C xenograft tumors (D) and C643 xenograft tumors (E). (F) Quantification of the percentage of CD11b+ F4/80+ CD206+ cells (n = 3–5). (G,H) Representative histograms of Arg1 (G) and iNOS (H) expression in CD206low/int (blue histograms) and CD206high (pink histograms) populations in total cells from C643 xenograft tumors. (I) Mean fluorescence intensity (MFI) of Arg1/iNOS ratio in the CD206high group and in the CD206low/int group (n = 8–10). Data are expressed as mean ± SEM of 3 independent experiments. ** p < 0.005.

