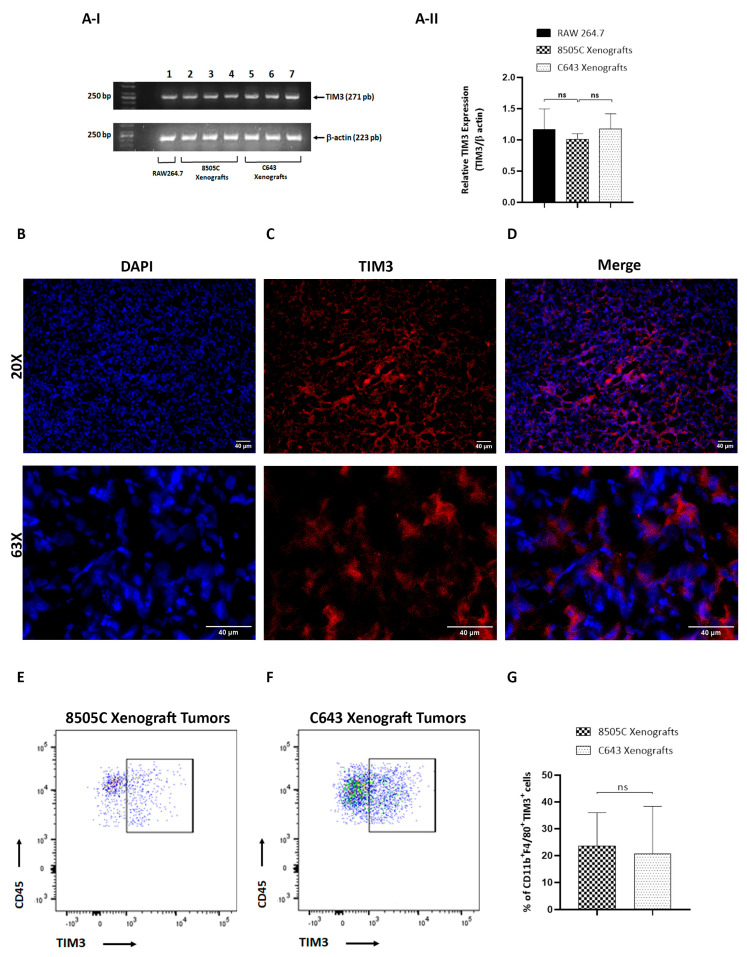
Figure 4.
TIM3-positive macrophages were recruited to ATC xenograft tumors. (A) I. Upper panel: TIM3 mRNA expression in RAW264.7 cells and in ATC xenografts. Total RNA was isolated, and the mRNA expression of TIM3 was examined by RT-PCR analysis. Lane 1, RAW264.7 cells; lanes 2–4, 8505C xenograft tumors (n = 3); lanes 5–7, C643 xenograft tumors (n = 3). The lower panel represents the expression of actin. II. TIM3 mRNA expression was normalized by β-actin. Densitometry analysis of TIM3 is shown. Representative results of 3 independent experiments. (B–D) 20X and 63X images of 5 µm thick 8505C xenograft tumor sections immunostained with TIM3-PE antibody (red). Nuclei were counterstained with DAPI. Representative immunofluorescence images of 3 independent experiments. (E–G) Representative FACS analysis of 2 independent experiments of macrophages (CD11b+ F4/80+ TIM3+) out of all CD45+ cells in the 8505c xenograft tumors (E) and C643 xenograft tumors (F). (G) Quantification of the percentage of TIM3+ cells (n = 6–8).

