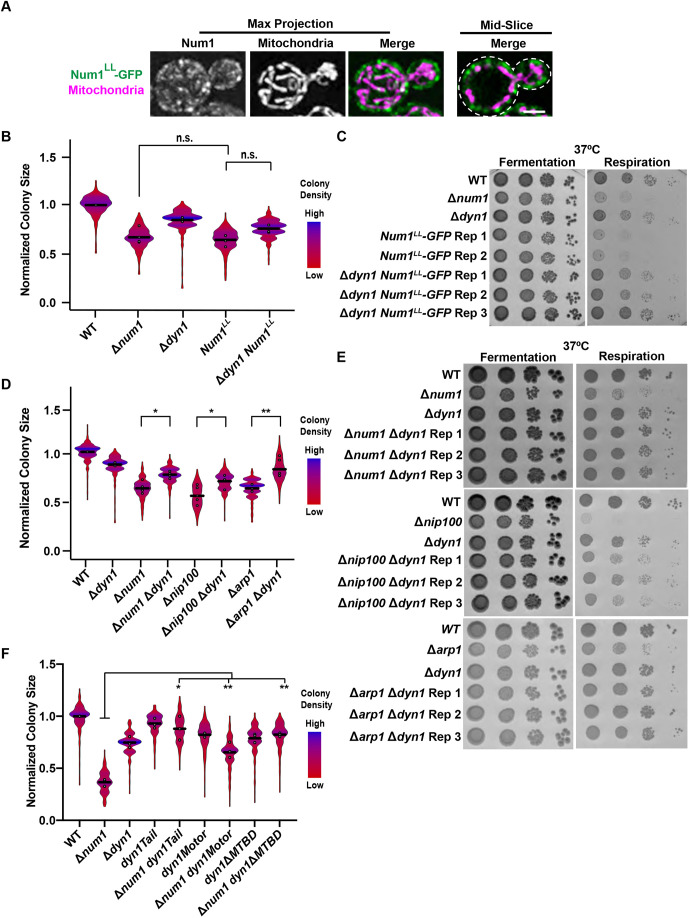
Fig. 5.
The role of Num1 in anchoring dynein, and not its role in mitochondrial tethering, contributes to the Δnum1 respiratory growth defect. (A) Cells expressing mito-dsRED and Num1LL–GFP were grown in respiratory growth conditions and analyzed by fluorescence microscopy. Whole-cell maximum intensity projections and a single focal plane from the middle of the cell are shown. Dashed white lines denote the outline of the cell. Scale bar: 2 µm. (B) Quantification, presented as a violin plot, of WT, Δnum1, Δdyn1, Num1LL-GFP, and Δdyn1 Num1LL-GFP cell growth at 35°C in respiratory growth conditions as described in Fig. 1E. Black line denotes the grand mean of at least three independent experiments and the circles depict the mean of each independent experiment; n≥328 colonies per strain. (C) To supplement the colony size assays shown in Fig. 5B, serial dilutions of the indicated strains were spotted onto YPD (fermentative growth condition) or YPEG (respiratory growth condition) agar plates and grown at 37°C. (D) Quantification, presented as a violin plot, of WT, Δnum1, Δdyn1, Δnum1 Δdyn1, Δnip100, Δdyn1 Δnip100, Δarp1 and Δdyn1 Δarp1 growth at 35°C in respiratory growth conditions as described in Fig. 1E. Black line denotes the grand mean of at least three independent experiments and the circles depict the mean of each independent experiment; n≥312 colonies per strain. The fold change in colony size between a double mutant and its respective single mutant was 1.3x for all genotypes examined. (E) To supplement the colony size assays shown in Fig. 5D, serial dilutions of the indicated strains were spotted onto YPD (fermentative growth condition) or YPEG (respiratory growth condition) agar plates and grown at 37°C. Rep 1, 2 and 3 denote three independent isolates of the indicated genotype. Δdyn1 data are recapitulated from Fig. 5B. (F) Quantification, presented as a violin plot, of WT, Δnum1, Δdyn1, dyn1Tail, Δnum1 dyn1Tail, dyn1Motor, Δnum1 dyn1Motor, dyn1ΔMTBD and Δnum1 dyn1ΔMTBD cell growth at 35°C in respiratory growth conditions as described in Fig. 1E. The black line denotes the grand mean of at least three independent experiments and the circles depict the mean of each independent experiment; n≥291 colonies per strain. Images shown in A, C and E are representative of at least two repeats. **P≤0.01, *P≤0.05, n.s., not significant (two-tailed unpaired t-test).

