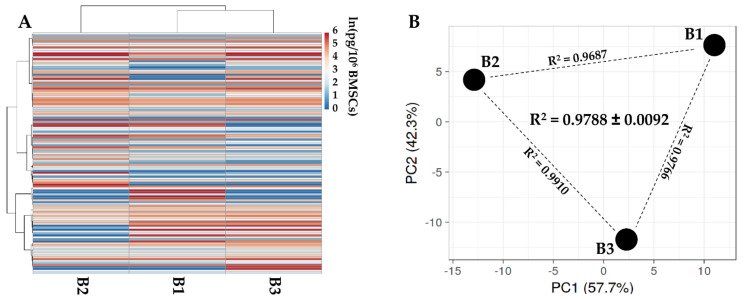
Figure 2.
Comparison of secreted factor profiles between SF-treated BMSCs under study. (A), heat map of hierarchical clustering analysis of the ln(x) transformed pg/million BMSCs values of detected factors with sample clustering tree at the top. The color scale reflects the absolute expression levels: red shades = high expression levels and blue shades = low expression levels. B1, B2 and B3 stands for BMSC donors 1, 2 and 3. (B), principal component analysis of the ln(x) transformed pg/million BMSCs values of detected factors. X and Y axes show principal component 1 and principal component 2, which explain 57.7% and 42.3% of the total variance. B1, B2 and B3 stands for BMSC donors 1, 2 and 3.

