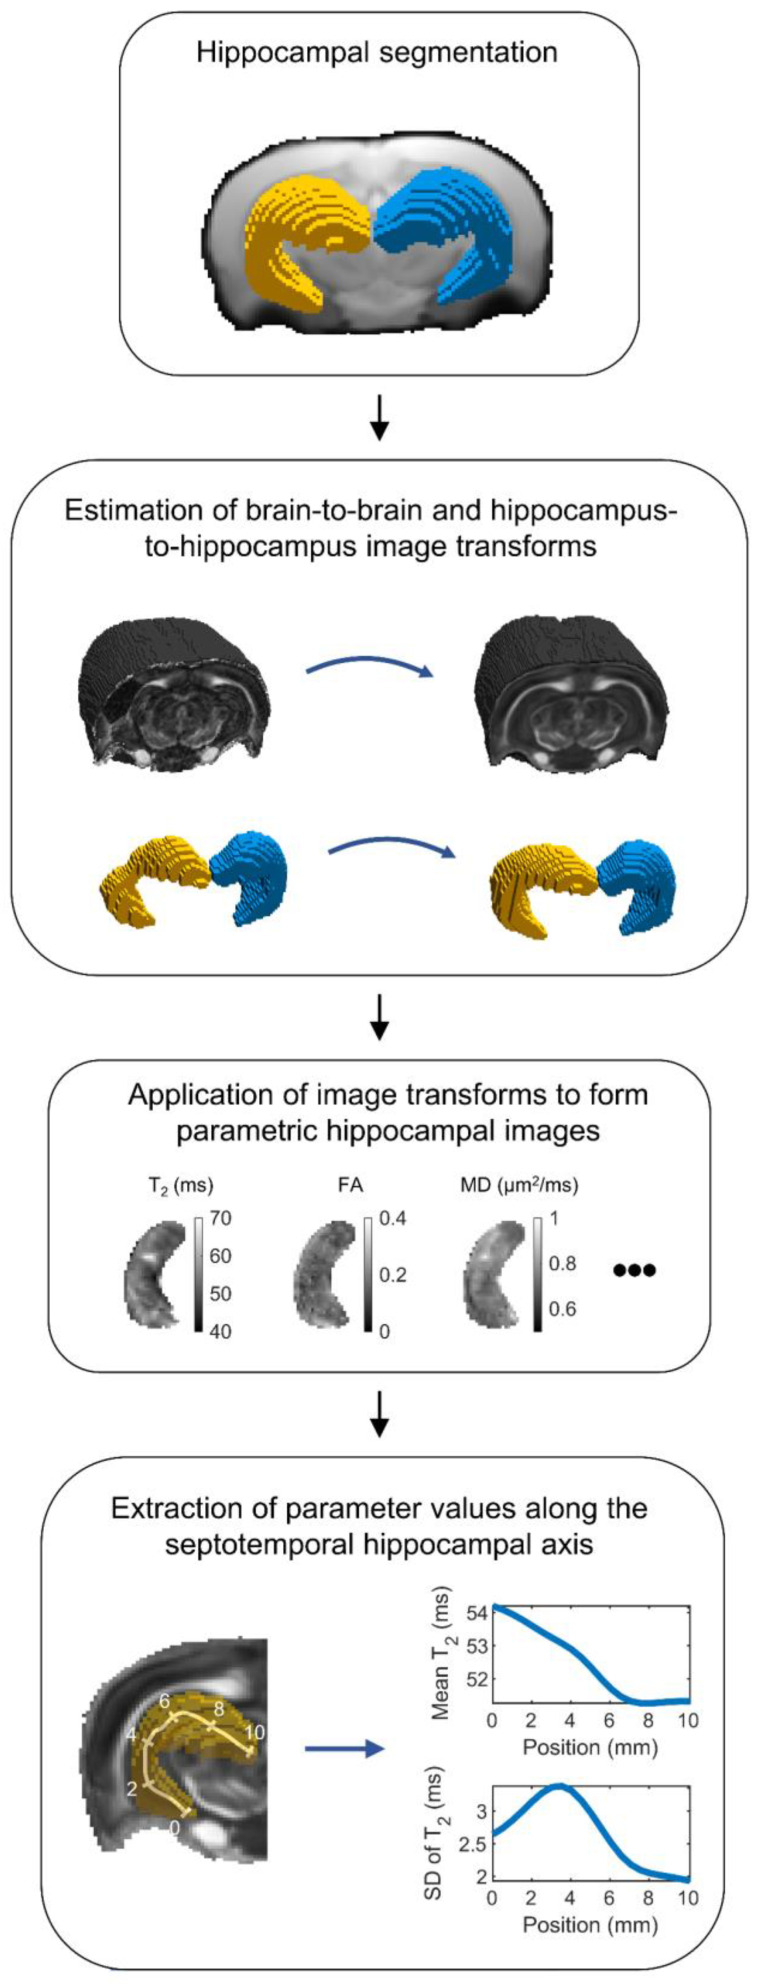
Figure 2.
Flowchart of the MRI analysis. First, the ipsilateral and contralateral hippocampi were segmented for each animal using an automated machine learning-based segmentation method. Then, the segmented hippocampal masks were used to estimate image transformations from the hippocampus of each animal to the reference hippocampus. The estimated image transformations were then applied to MRI parameter maps to form parametric hippocampal images in the same reference space. Finally, the hippocampus was skeletonized along its septotemporal axis, and the weighted mean and standard deviation (SD) of each quantitative MRI parameter was calculated along the axis. Abbreviations: FA, fractional anisotropy; MD, mean diffusivity.

