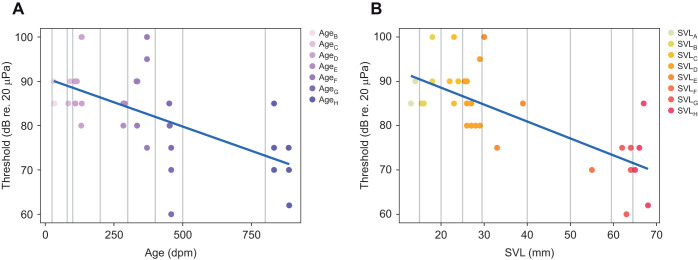
Fig. 3.
Auditory thresholds at the mating call frequency (1600 Hz) as a function of age and size. Blue lines indicate the fitted linear regression: (A) age, R2=0.3554; and (B) SVL, R2=0.5067. Grey vertical lines indicate the groups. Group ageA is not included in A, as this group had no responses to this frequency.

