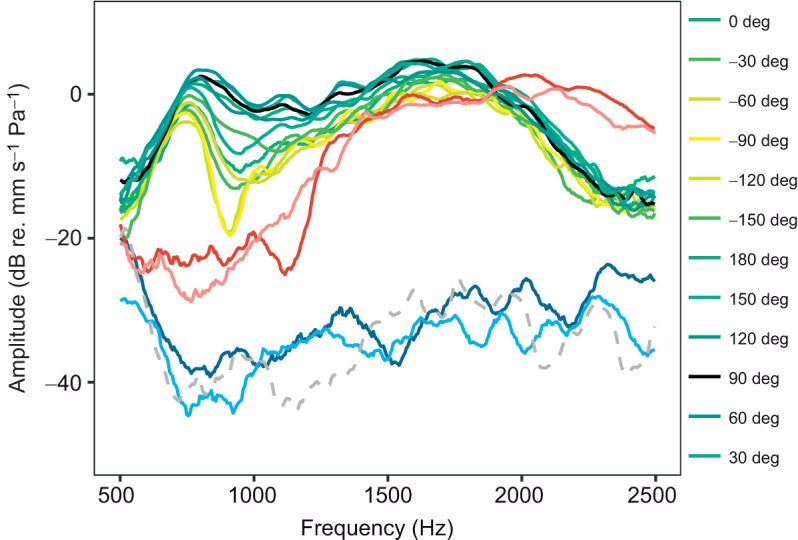
Fig. 7.

Vibration velocity spectra (transfer functions) of the eardrum in three differently sized toads. The response of the eardrum to sounds from 12 directions is shown for an adult, wild-caught individual, of size 62 mm SVL. Black represents the ipsilateral sound direction (90 deg), yellow represents the contralateral sound direction (−90 deg) and green represents intermediate directions, as shown in the key (darker shading: ipsilateral, lighter shading: contralateral). The lung resonance frequency coincides with the peak below 1000 Hz. The largest amplitude is seen at 1500 Hz. The differences in amplitude between the 12 speakers around 1000 Hz are caused by the directionality of the tympanic middle ear system. The response is also shown for a 39 mm SVL individual, where red represents the ipsilateral sound direction (90 deg) and pink represents the contralateral sound direction (−90 deg), and for a 28 mm SVL individual, where dark blue represents the ipsilateral sound direction (90 deg) and light blue represents the contralateral sound direction (−90 deg). The grey dashed curve shows the sound-induced vibration of the platform.
