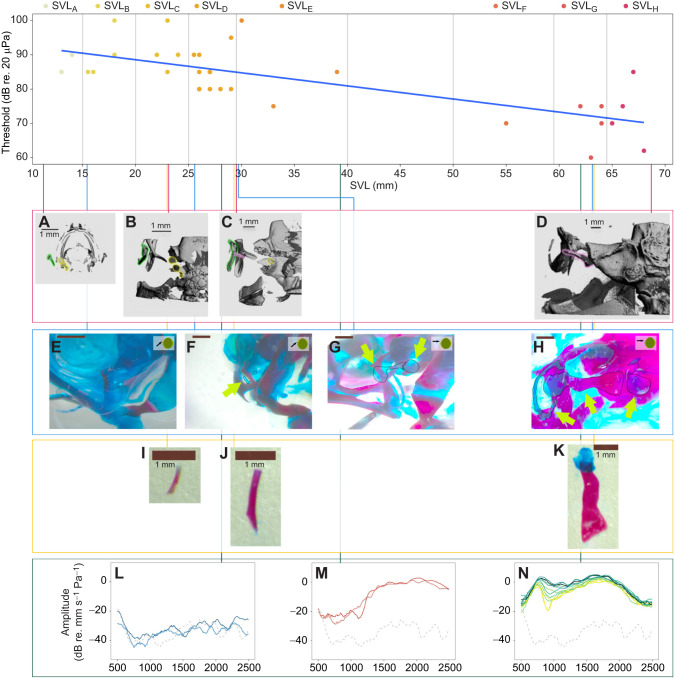
Fig. 8.
Summary of key findings. Top: increase of hearing sensitivity to the dominant frequency of the mating call (1600 Hz). Red box: dorsal view µCT scans of the left side otic region of four individuals: (A) 11 mm SVL/4 dpm, (B) 23 mm SVL/110 dpm, (C) 29 mm SVL/131 dpm, (D) 68 mm SVL/887 dpm. Otoliths are outlined in yellow, the squamosal is outlined in green and the columella is outlined in pink. Blue box: differential staining of cranial regions of four individuals: (E) 15.5 mm SVL/33 dpm, no trace of any middle ear structures; (F) 25.5 mm SVL/335 dpm, a small aggregation of blue cells, will probably form the extra-columella, and a tiny columella shaft; the operculum (not outlined) is visible to the right of the outlined columella; (G) 29 mm SVL/370 dpm, thin extra-columella, connected to the shaft and the footplate; the operculum is also outlined; (H) 63 mm SVL/458 dpm, fully developed middle ear, from left: tympanic annulus, extra-columella, columella shaft, columella footplate and operculum. Yellow box: differentially stained columellae of three individuals: (I) 23 mm SVL/132 dpm, (J) 29 mm SVL/131 dpm and (K) 63 mm SVL/458 dpm. Bone is red, cartilage is blue. Green arrows point to middle ear structures. Green box: vibration velocity spectra (transfer functions) of the eardrum in three toads: (L) 28 mm SVL/453 dpm, dark blue is the ipsilateral sound direction (90 deg), light blue is the contralateral sound direction (−90 deg); (M) 39 mm SVL/133 dpm, red is the ipsilateral sound direction (90 deg), pink is the contralateral sound direction (−90 deg); (N) the response of the eardrum to sounds from 12 directions in an adult, wild-caught individual (SVL 62 mm); black curve is the ipsilateral sound direction (90 deg), yellow is the contralateral sound direction (−90 deg). The peak below 1000 Hz is caused by resonance in the lung; the peak above 1500 Hz is caused by vibration of the eardrums. The differences in amplitude between the 12 speakers around 1000 Hz are caused by the directionality of the tympanic middle ear system. The grey dashed curve is the sound-induced vibration of the platform.

