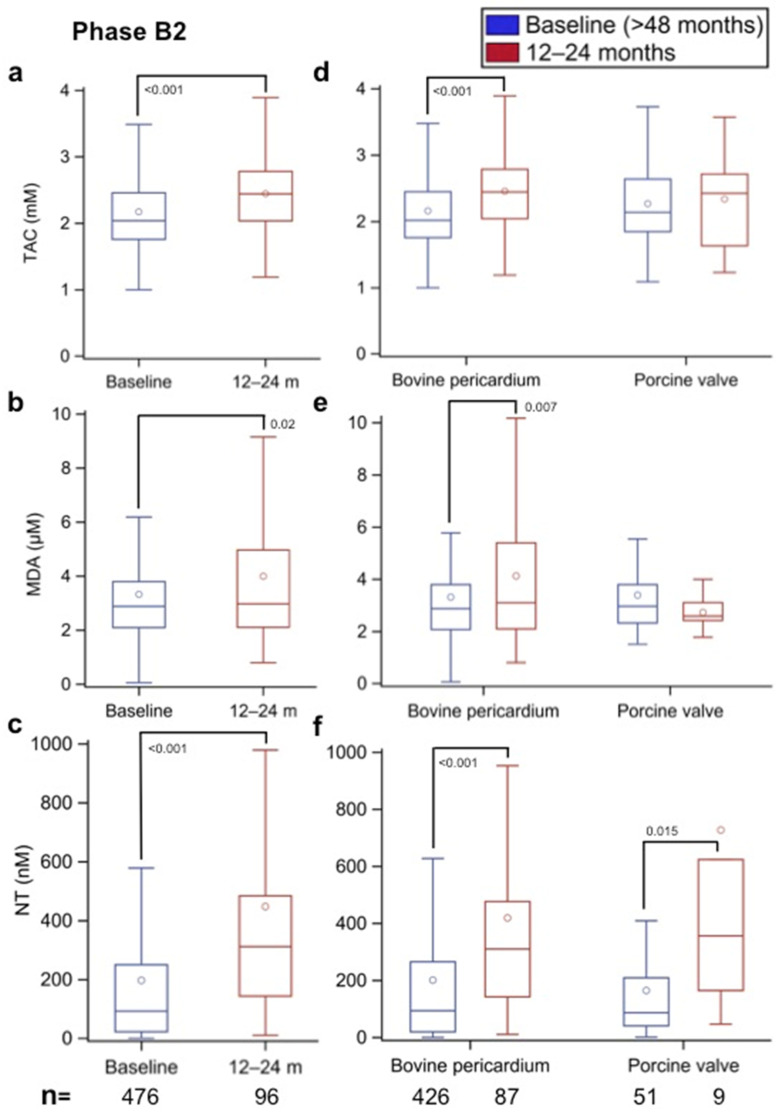
Figure 6.
(a,d) Total antioxidant capacity (TAC, in mm), (b,e) malondialdehyde (MDA, in µm), and (c,f) nitrotyrosine (NT, in nm) values in Phase B2 patients with all types of implanted aortic biological heart valves (BHVs) and in Phase B2 patients with implanted bovine pericardium and porcine aortic BHVs, respectively, at the time of recruitment (>48 months after surgery) and after 12–24 months of follow-up (>60–72 months after aortic valve implantation). The numbers within the figures represent the p-values, and the numbers at the bottom of the figures represent the number of assessed patients. Multiple comparison adjustments were performed with Dunnett’s and Tukey–Kramer’s procedures.

