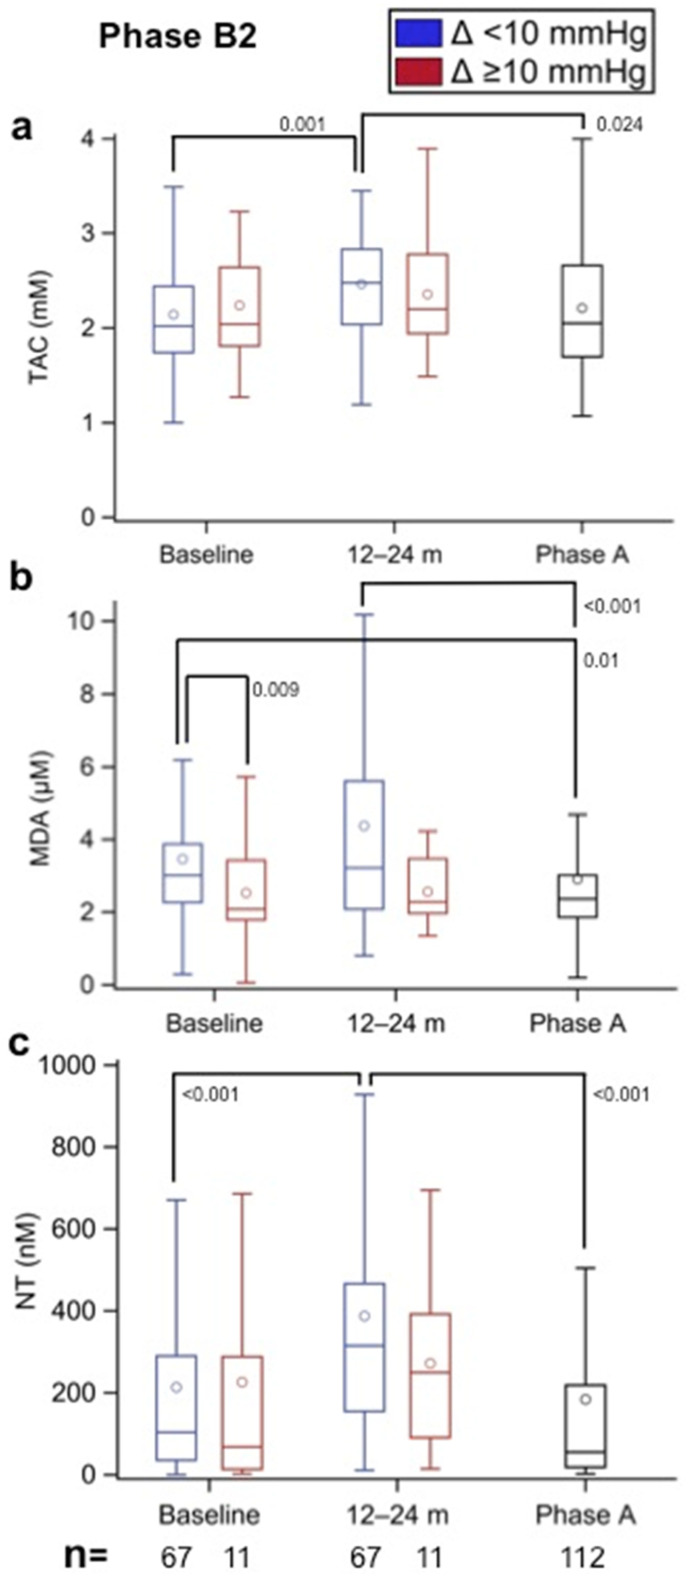
Figure 7.
(a) Total antioxidant capacity (TAC, in mm), (b) malondialdehyde (MDA, in µm), and (c) nitrotyrosine (NT, in nm) values in Phase A patients (established SVD) and in Phase B2 patients with implanted aortic biological heart valves (BHV) according to the observed increment (Δ) in mean aortic prosthesis gradient (Δ < 10 mmHg—without incipient SVD; Δ ≥ 10 mmHg—with incipient SVD) between the baseline (>48 months after aortic valve implantation) and 12–24 months of follow-up (>60–72 months after aortic valve implantation). Therefore, each patient acted as his or her own control (e.g., paired results). The numbers within the figures represent the p-values, and the numbers at the bottom of the figures represent the number of assessed patients. Multiple comparison adjustments were performed with Dunnett’s and Tukey–Kramer’s procedures.

