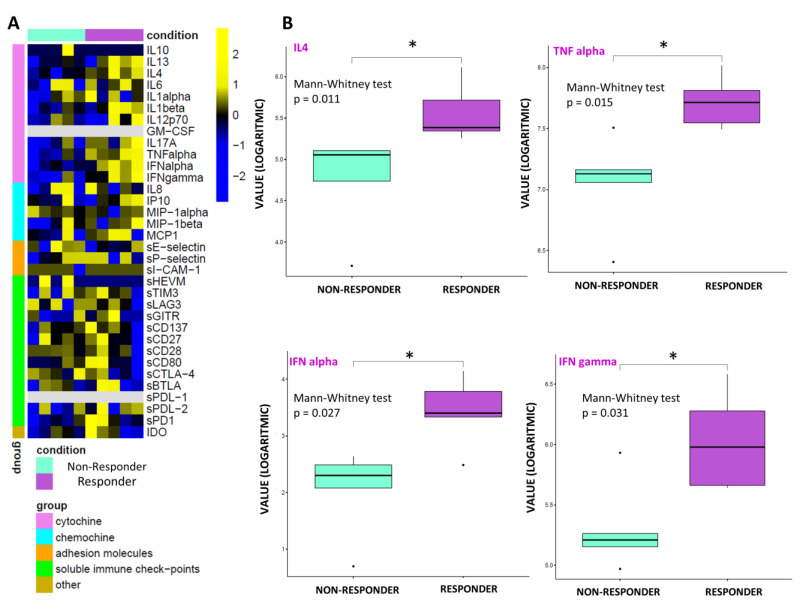
Figure 2.
Statistical analysis at T1. (A) Heatmap of molecule expression levels (logarithmic scale) at T1 across 10 patients, grouped by therapy responder (violet bars) and non-responder (water blue bars). Colors represent different expression levels, increasing from blue to yellow. (B) Boxplot of molecule expression levels (logarithmic scale) in 5 responder patients (violet box) and 5 non-responder ones (water blue box) at T1. p-values (p) were obtained by performing a Mann–Whitney test for unpaired samples. Only molecules showing a statistically significant difference between the two groups are shown. Legend: * p ≤ 0.05.

