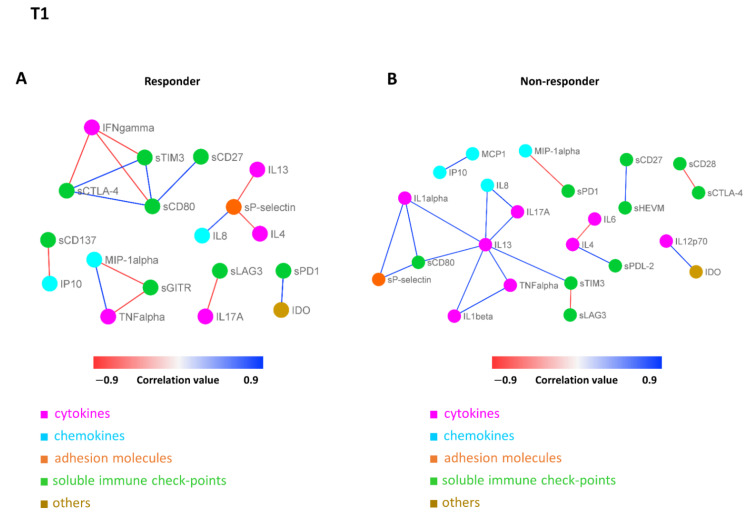
Figure 7.
Connectivity network between molecules in responder (A) and non-responder (B) patients at T1. In each network, nodes represent molecule, and a link occurs between two nodes if the absolute value of Spearman correlation between their expression levels is statistically significant (p-value ≤ 0.05) and greater than a selected threshold (i.e., the 85th percentile of the overall distribution corresponding to 0.8). Nodes are colored according to the functional groups reported in the legend, whereas edge colour indicates positive (blue) or negative (red) correlation values.

