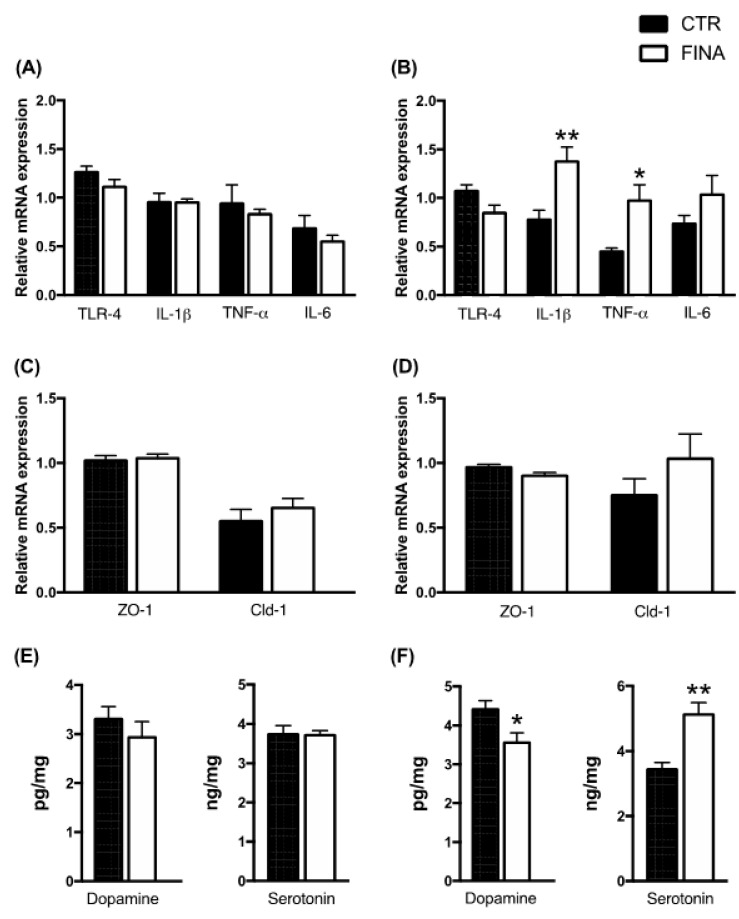
Figure 3.
Gene expression of pro-inflammatory markers (A,B); gut permeability markers (C,D) detected by real-time PCR in colon of controls (CTR) and finasteride-treated rats (FINA) after drug treatment (A,C) and at withdrawal (B,D). The columns represent the mean ± SEM after normalization with 36B4 mRNA, n = 6 for each group. Levels of dopamine and serotonin (E,F) detected by LC-MS/MS in the colon of controls and finasteride-treated rats after drug treatment (E) and at withdrawal (F). Data are expressed in pg/mg or ng/mg ± SEM, n = 6 for each group. The unpaired Student’s t-test was used for statistical * p < 0.05, ** p < 0.01 vs. control group.

