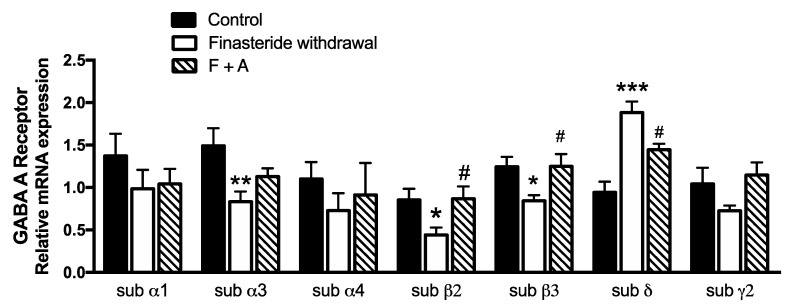
Figure 5.
Gene expression of GABA-A receptor subunits α1, α3, α4, β2, β3, δ and γ2 in the colon of controls, finasteride-treated rats and ALLO-treated rats after drug withdrawal. The columns represent the mean ± SEM after normalization with 36B4 mRNA, n = 7 for each group. The effect of treatment of ALLO was analyzed using one-way ANOVA followed by Uncorrected Fisher’s LSD post hoc test (significance: * p < 0.05, ** p < 0.01, *** p < 0.001 vs. control group; # p < 0.05 vs. finasteride-treated rats).

