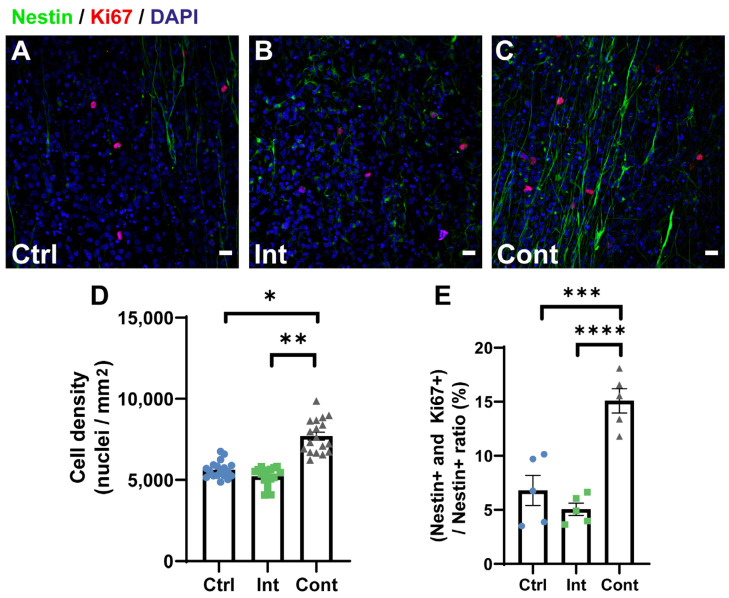
Figure 2.
(A–C): representative images of immunocytochemistry staining for Nestin (green), Ki67 (red) and DAPI (blue) of the control (A), intermittent stimulation (B), and continuous stimulation (C) groups. Scale bars: 20 µm. (D,E): Quantification results of cell density and embryonic proliferating cells percentage (Nestin+ and Ki67+/Nestin+) for the control (Ctrl), intermittent stimulation (Int), and continuous stimulation (Cont) groups after 7 days of differentiation culture. (D) Cell density quantification results (Ctrl: 5632 ± 122 nuclei/mm2; Int: 5226 ± 134 nuclei/mm2; Cont: 7702 ± 243 nuclei/mm2). Statistical differences tested by a nested one-way ANOVA. (E) Percentage of embryonic proliferating cells (Ctrl: 6.8 ± 1.4%; Int: 5 ± 0.6%; Cont: 15.1 ± 1.1%). Statistical differences tested by ordinary one-way ANOVA. Data are expressed as mean ± SEM. * p < 0.05; ** p < 0.01; *** p < 0.001; **** p < 0.0001.

