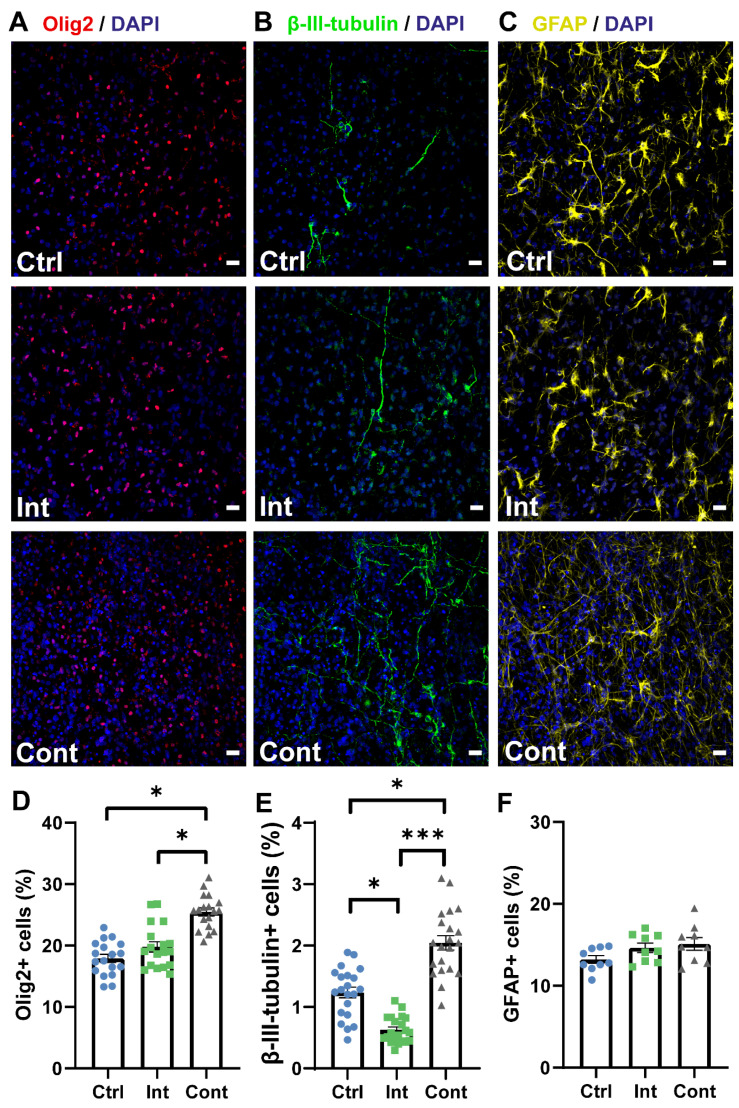
Figure 3.
(A–C): Representative images of immunocytochemistry staining for DAPI (blue) and Olig2 (red) (A), β-III-tubulin (green) (B), and GFAP (yellow) (C) of the control, intermittent stimulation, and continuous stimulation groups. Scale bars: 20 µm. (D–F): Quantification results of the oligodendrocyte percentage (Olig2-positive cells/DAPI), neuron percentage (β-III-tubulin-positive cells/DAPI), and astrocyte percentage (GFAP-positive cells/DAPI), respectively, for the control (Ctrl), intermittent stimulation (Int), and continuous stimulation (Cont) groups. (D) Percentage of Olig2+ cells (Ctrl: 17.92 ± 0.65%; Int: 19.79 ± 0.83%; Cont: 25.47 ± 0.66%). (E) Percentage of β-III-tubulin+ cells (Ctrl: 1.24 ± 0.09%; Int: 0.63 ± 0.05%; Cont: 2.04 ± 0.12%). (F) Percentage of GFAP+ cells (Ctrl: 13.21 ± 0.47%; Int: 14.63 ± 0.57%; Cont: 15.11 ± 0.78%). Statistical differences tested by a nested one-way ANOVA. Data are expressed as mean ± SEM. * p < 0.05; *** p < 0.001.

