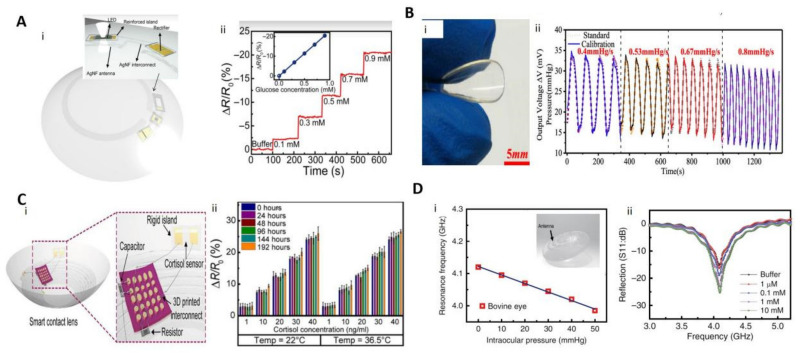
Figure 3.
Several contact lens sensors based on 2D materials. (A): (i) Glucose contact lens sensor and schematic diagram of the structure. (ii) Variation in the resistance of the sensor in different concentrations of glucose [117]. Copyright 2018, American Association for the Advancement of Science. (B): (i) Optical photograph of the IOP contact lens sensor. (ii) Comparison between the calibrated IOP and the standard IOP at different speeds [118]. Copyright 2020, American Chemical Society. (C): (i) Cortisol contact lens sensor and schematic diagram of the structure. (ii) Variation in the resistance of the sensor at different temperature and time states [119]. Copyright 2020, American Association for the Advancement of Science. (D): (i) Frequency response of the intraocular pressure sensor on the bovine eye from 5 mm Hg to 50 mmHg. Illustrations show schematic diagram of the structure of the composite contact lens sensor. (ii) Wireless monitoring of glucose concentrations from 1 μM to 10 mM [47]. Copyright 2017, Springer Nature.

