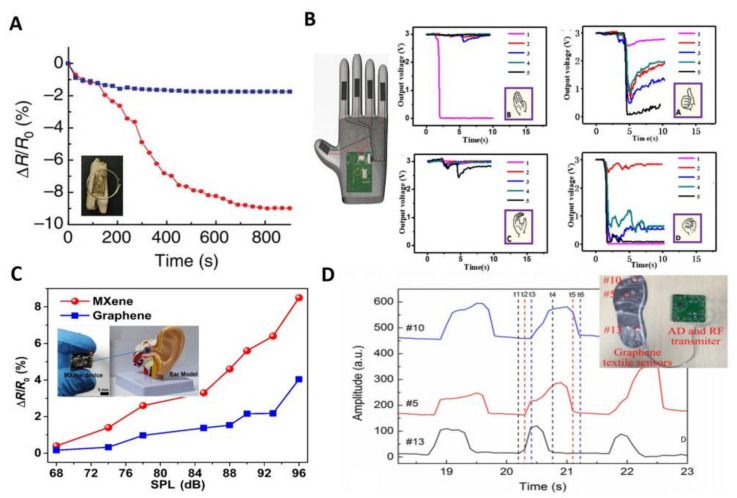
Figure 4.
Several other wearable sensors based on 2D materials. (A): Percentage change in graphene resistance over time after exposure of the dental patch sensor to approximately 100 H. pylori cells in human saliva (red line). The response to a “blank” saliva solution is shown as a blue line [48]. Copyright 2012, Springer Nature. (B): Glove sensor for different schematics and the voltage output for different gestures [49]. Copyright 2021, Springer Nature. (C): Cochlear sensor resistance change with decibels; inset shows the MXene cochlear sensor [124]. Copyright 2021, Multidisciplinary Digital Publishing Institute. (D): Photograph of the foot sensor and comparison of the forces applied to each part(#5#10#13 in the illustration in the upper right corner correspond to the pressure sensors at different locations on the bottom of the three feet respectively.) [126]. Copyright 2017, Multidisciplinary Digital Publishing Institute.

