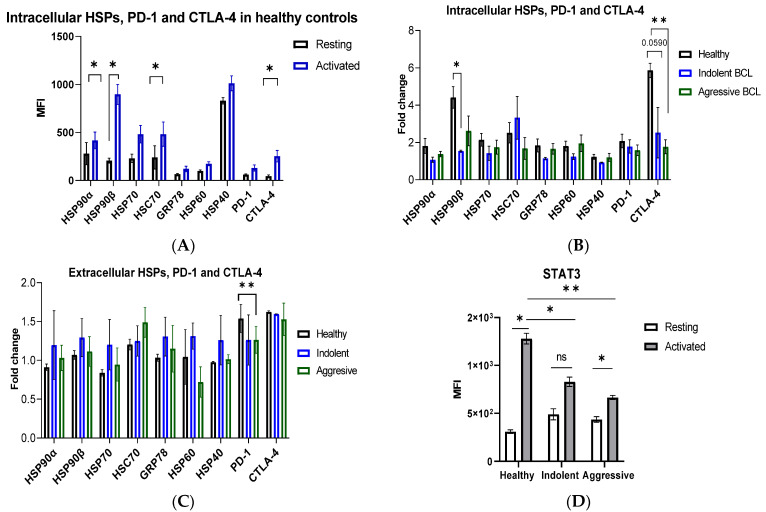
Figure 1.
HSP, PD-1, CTLA-4, and STAT3 expression in activated T cells. (A) Intracellular expression of HSPs, PD-1, and CTLA-4 (as mean fluorescence intensity, MFI) in activated T cells in healthy controls. Pan T cells were isolated from healthy PBMCs and stimulated with anti-CD3/CD28 or unstimulated (resting) for 48 h. (B) Intracellular HSPs, PD-1, and CTLA-4 in indolent and aggressive lymphoma patients. (C) Extracellular HSPs, PD-1, and CTLA-4 in indolent and aggressive lymphoma patients. The fold change in MFI was calculated by normalizing the activated to the resting T cells. (D) STAT3 expression in resting and activated T cells in healthy controls and lymphoma patients. Data represents mean ± SEM. ns, not significant, * p < 0.05, ** p < 0.01.

