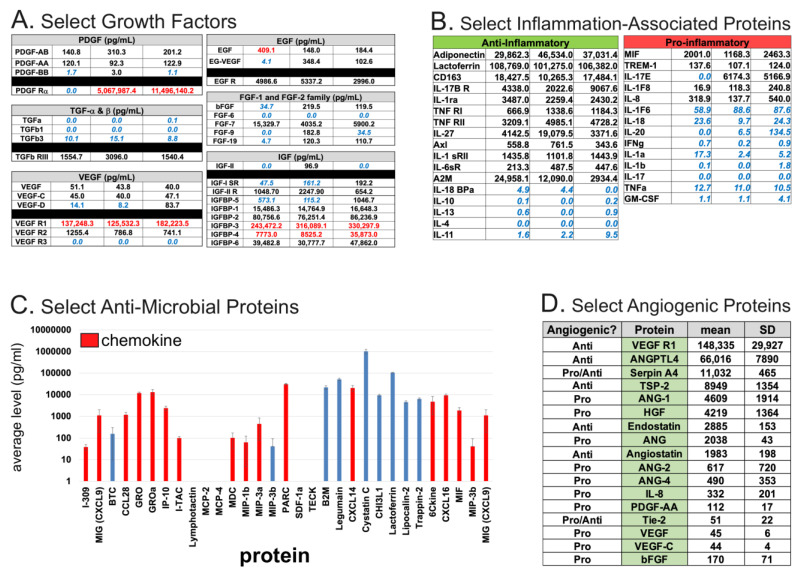
Figure 2.
Summaries of select biomolecules of interest identified by multiplexed ELISA [15]. Each classification of the proteins shown was based on Gene Ontology annotations from the above-referenced study. (A). Select growth factors measured by ELISA from three independent donor-derived clinical grade cfAF samples. The growth factor is indicated by top header and left-most column, with the levels (pg/mL) measured indicated for each of three independent donors. Values in blue text indicated those below the level of detection for positive control, and those in red text indicate those above the level of detection for positive control. (B). Select inflammation-associated proteins measured as in part (A), and separated by anti-inflammatory (left) or pro-inflammatory (right) annotation. Values are shown in pg/mL and for each donor-specific batch of clinical grade cfAF as in (A). (C). Select mean values (pg/mL) of anti-microbial proteins shown by bar graph with error bars indicating standard deviation, as calculated in (A,B). Those shown in red are also annotated as chemokines. (D). Select angiogenic proteins shown, with “Angiogenic?” column header indicating whether the specific protein is annotated as pro- or anti-angiogenic, “Protein” column header indicating protein name, “mean” indicating mean value (pg/mL) from the three independent donor-derived lots of clinical grade cfAF as above, and “SD” indicating the standard deviation from the mean value.

