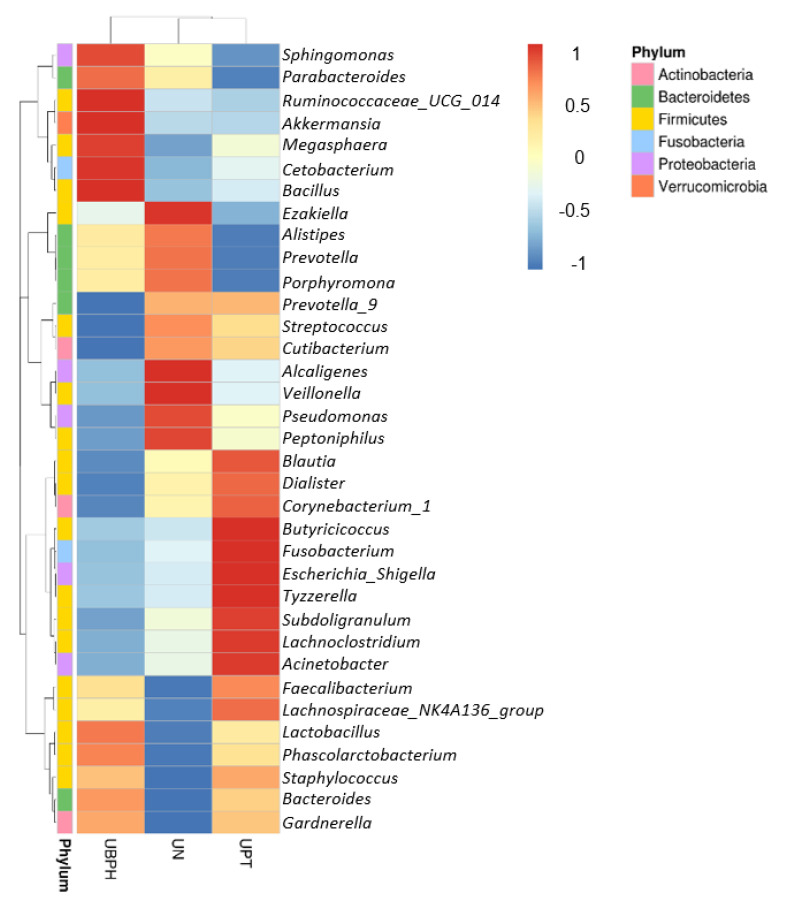
Figure 5.
Genus heat map lists down the top 35 genera identified in urine sample. The z-score of each genus abundance in each group is shown in different color. The z-score is computed on a genus-by-genus (row-by-row) basis by subtracting the mean and then dividing by the standard deviation. The right upper -1–1 color bar stands for standardized z-score. UBPH stands for patients with BPH. UN stands for control group. UPT stands for patients with prostate cancer.

