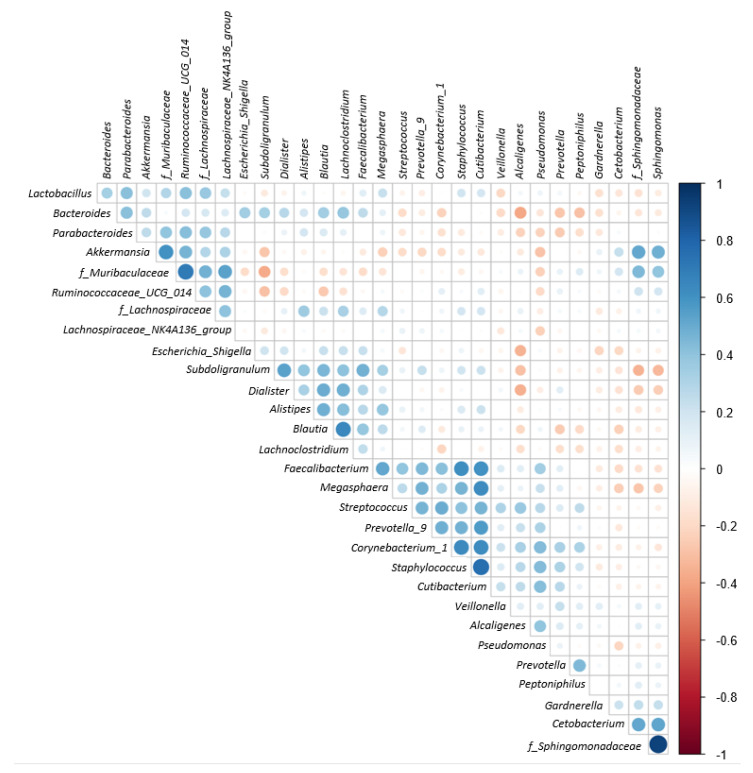
Figure 9.
Spearman correlation coefficient plot for exploring dependency between genera. Those categories starting with “f_” means that its “family” taxonomic information is recorded instead of genus. Different color shade of right side color bar represents Spearman correlation coefficient. Blue means positive correlation; red means negative correlation.

