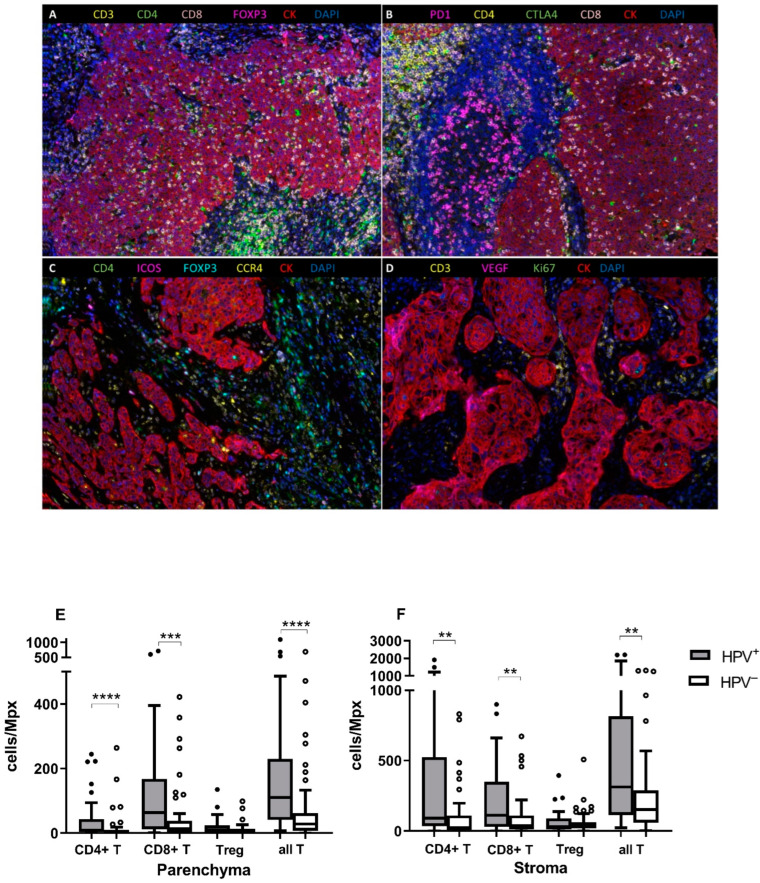
Figure 1.
Representative multispectral fIHC staining of FFPE tissue samples with four antibody panels, 20X magnification. (A) CD3 (yellow), CD4 (green), CD8 (pink), FOXP3 (magenta), CK (red), and DAPI (blue) staining. (B) PD-1 (magenta), CD4 (yellow), CTLA4 (green), CD8 (pink), CK (red), and DAPI (blue) staining. (C) CD4 (green), ICOS (magenta), FOXP3 (cyan), CCR4 (yellow), CK (red), and DAPI (blue) staining. (D) CD3 (yellow), VEGF (magenta), Ki67 (green), CK (red), and DAPI (blue) staining. T lymphocytes infiltration in the parenchyma and the stroma compartments according to tumor etiology. (E) The numbers of CD3+CD4+, CD3+CD8+, all CD3+ T lymphocytes, and Treg cells per Mpx were compared between the HPV+ and HPV− groups in the parenchyma and (F) the stroma compartments. Significantly higher infiltration of CD3+CD4+, CD3+CD8+, and all CD3+ T lymphocytes was observed in the HPV+ groups in both compartments. The observed difference for Treg cells was not statistically significant. ** p ≤ 0.01, *** p ≤ 0.001, **** p ≤ 0.0001, Mann–Whitney U test.

