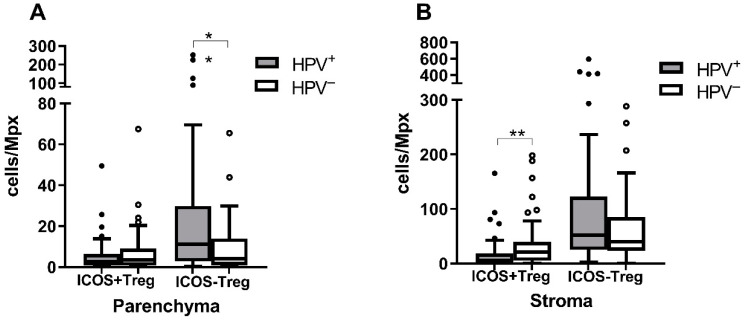
Figure 3.
Comparison of the ICOS+ and ICOS− Treg levels in the HPV+ and HPV− tumors. The numbers of Treg cells with or without ICOS production per Mpx were compared in (A) the parenchyma and (B) the stroma of the tumors of different etiology. Higher ICOS+ Treg levels were observed in both the parenchyma and stroma of the HPV− tumors, with the difference being significant for the stroma. Higher ICOS− Treg numbers were detected again in both the parenchyma and stroma of HPV+ tumors, with the difference being significant for the parenchyma. * p ≤ 0.05, ** p ≤ 0.01, Mann–Whitney U test.

