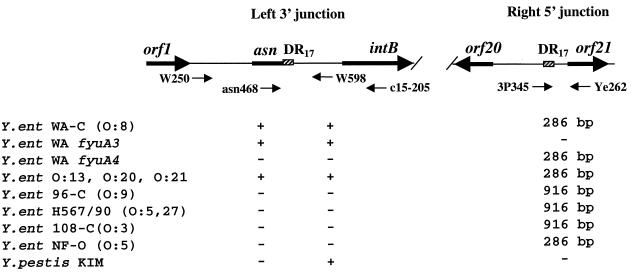
FIG. 5.
Left (5′) and right (3′) junctions of the Yen HPI. Arrows in the graph show position and orientation of the genes. Black arrows under the graph show PCR primers used. The + and − indicate the presence or absence of a PCR product amplified with W250 plus W598 and asn468 plus c15-205 primer pairs. Numbers correspond to the size of the PCR products in base pairs. Y.ent, Y. enterocolitica.

