Figure 1.
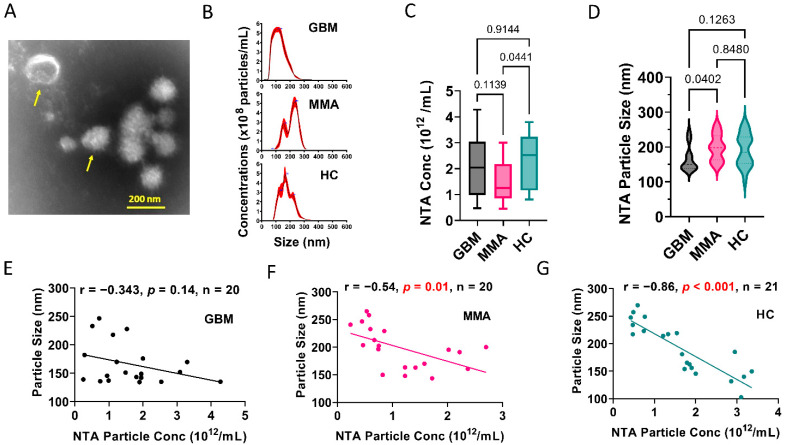
Glioblastoma plasma-derived extracellular vesicles possess unique phenotypes. (A). Representative transmission electron microscopic image of EVs derived from pooled GBM plasma. Yellow arrows show typical EVs. The mean size of the GBM EVs is 100–200 nm. (B). Nanoparticle Tracking Analysis (NTA) showing representative graphs for EVs purified from plasma of patients with GBM and MMA, and healthy controls (HC). (C). Summary of the number of EVs in the plasma of GBM, MMA, and HC, as determined by NTA. MMA EVs showed lower numbers of EVs (n = 20) compared to HC EVs (n = 21). (D). GBM plasma EVs are significantly smaller (n = 20) compared to MMA EVs (n = 20). The mean size of GBM EV is 166 nm. (E–G). Correlation analysis between NTA particle concentrations and particle sizes. (E). No correlation between concentration and size was observed for GBM EVs (r = −0.343, p = 0.14, n = 20). However, significantly correlated results were seen in MMA EVs (r = −0.54, p = 0.01, n = 20) (F) and HC EVs (r = −0.86, p < 0.001, n = 21) (G).

