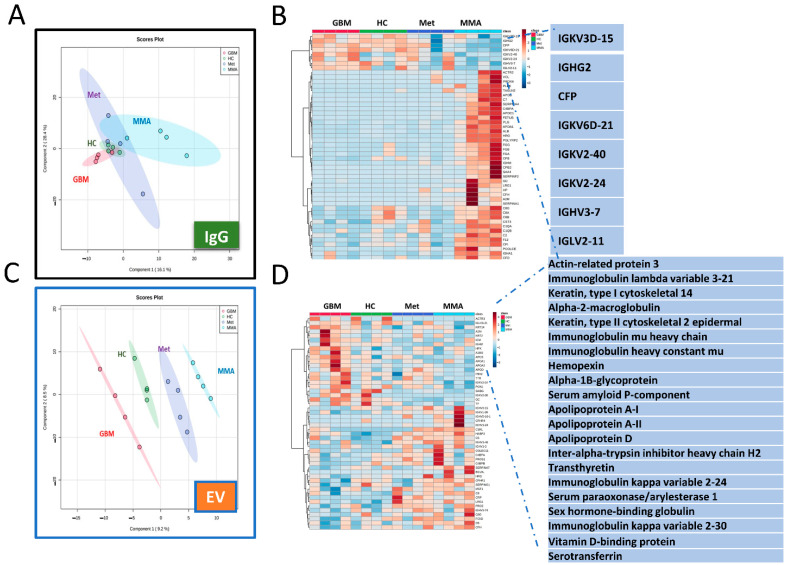
Figure 5.
Mass spectrometry proteomic analysis of EVs and purified IgG antibodies showing unique clusters of proteins in GBM. (A,B). Proteomic analysis for IgG antibodies. (A). Principal Component Analysis (PCA) showed distinctions among the four groups of samples including GBM, MMA, metastatic brain tumors (Met), and HC. (B). Heat map of total IgG proteomics showing the top 50 proteins in each group. The upregulated IgG antibodies in GBM, HC, and Met compared to MMA are highlighted. (C,D). Proteomic analysis of plasma EVs demonstrated the unique proteins in GBM EVs. (C). PCA shows clear clusters of proteins in each EV group. (D). Heat map showing unique proteins detected in GBM EVs including immunoglobulin heavy and light chains and apolipoproteins.

