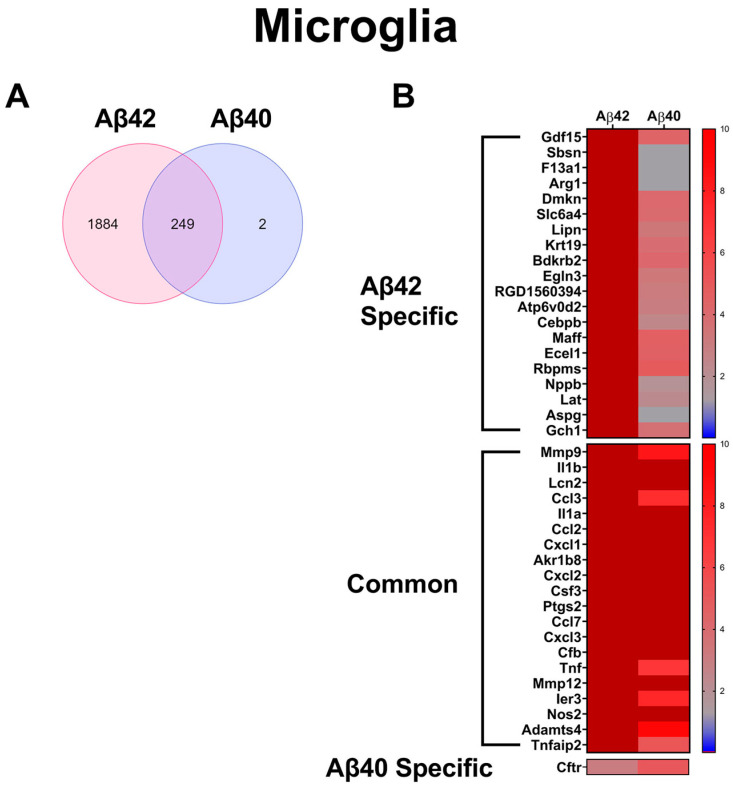
Figure 5.
Significantly increased genes in primary microglia treated with Aβ42 or Aβ40 fibrils. (A) Venn diagram comparing significantly (p < 0.05) up-regulated genes, >5-fold of untreated controls, in primary microglia treated with Aβ42 or Aβ40 fibrils (n = 3). (B) Heat maps depicting relative expression of most enhanced genes specific to Aβ42 fibril treatment, common to both Aβ42 or Aβ40 fibril treatments and specific to Aβ40 fibril treatment, together with the corresponding expression in the other treatment groups.

