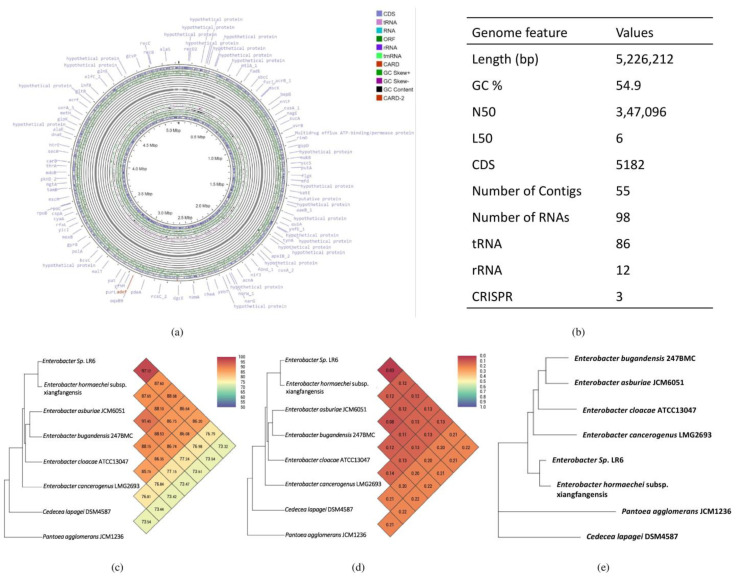
Figure 2.
Graphical circular map of Enterobacter sp. LR6. The green color and gray color represent the open reading frame and contigs, respectively. The outer circle in orange and blue color shows predicted antibiotic resistance and protein-coding sequences (a), the table showing its general genome feature (b), heat map and phylogenetic tree based on (c) ANI, (d) GGDC distance, and (e) whole-genome sequence of Enterobacter sp. with its closely related taxa.

