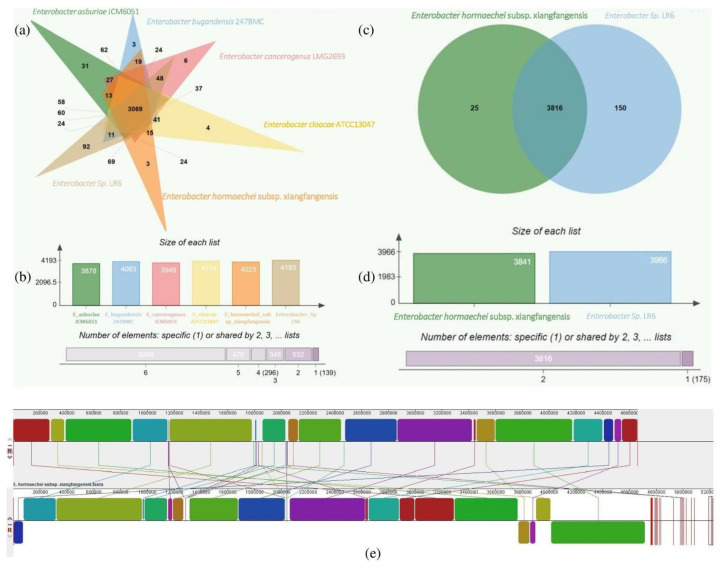
Figure 3.
Venn diagram representing the distribution of unique and shared proteins among Enterobacter sp. LR6 and closely related genomes (a); the bar plot below the Venn diagram shows the number of proteins found in each species (b). Distribution of Enterobacter sp. LR6 proteins with the closest strain E. hormaechei subsp. Xiangfangensis genome (c); the bar plot shows the number of proteins found in Enterobacter sp. LR6 and E. hormaechei subsp. Xiangfangensis (d). Genome alignment of Enterobacter sp. LR6 and E. hormaechei subsp. Xiangfangensis genome constructed using MAUVE showing the genome-wide variation. The local collinear blocks (LCBs) in different colors represent conserved segment, white areas within LCBs represent regions with low similarity, and the scale represents the coordinates of each genome. The LCBs present above and below the central black horizontal line are the forward and reverse orientation, respectively. The rearrangement between the two genomes is represented by the colored lines (e).

