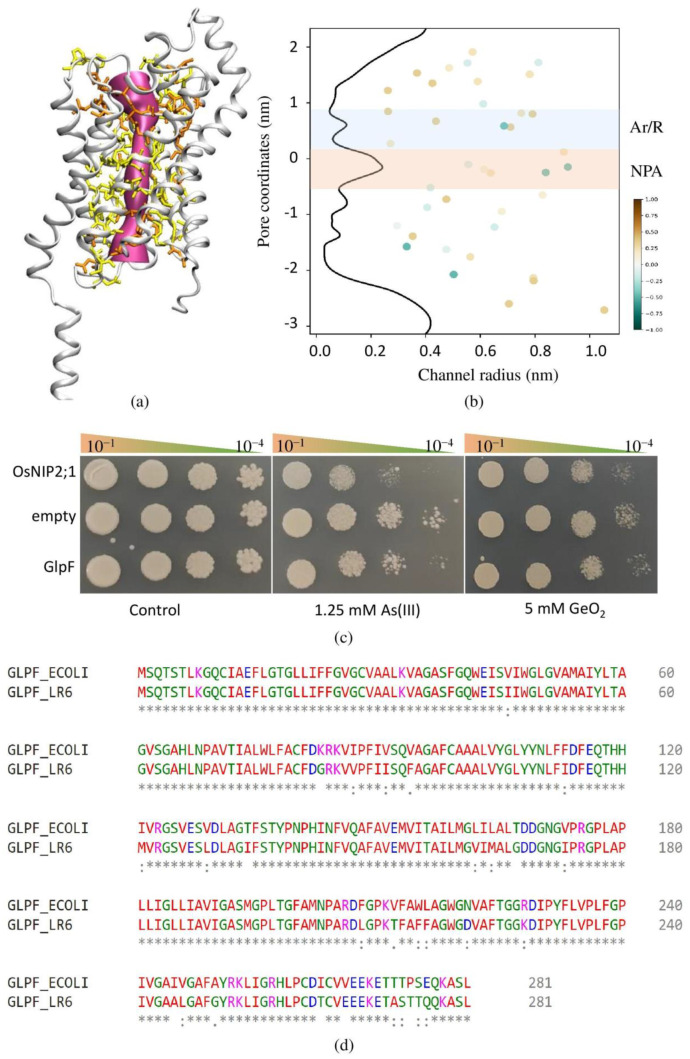
Figure 5.
Three-dimensional structure of Enterobacter GlpF. Pore-facing residues are represented in orange, while the pore-lining residues are in yellow (a). The pore radius for predicted Enterobacter GlpF plotted on z coordinates of protein. The position of hydrophilic and hydrophobic residues was spotted at the corresponding position. The representation of hydrophilic to hydrophobic residue is shown on green to brown scale using CHAP tool. The region shaded in light blue and orange color indicate the location of Ar/R residues and NPA motifs (b). Growth of yeast cell expressing aquaporin homolog of OsNIP2;1, GlpF transformed with pYES2 and empty vector. A total of 10 µL of diluted yeast transformant (10−1 to 10−4 dilution) was spotted on media containing various concentration of As (III) and GeO2. The growth was recorded after 4 days at 30 °C (c). Sequence alignment of LR6 GlpF with E. coli GlpF (d).

