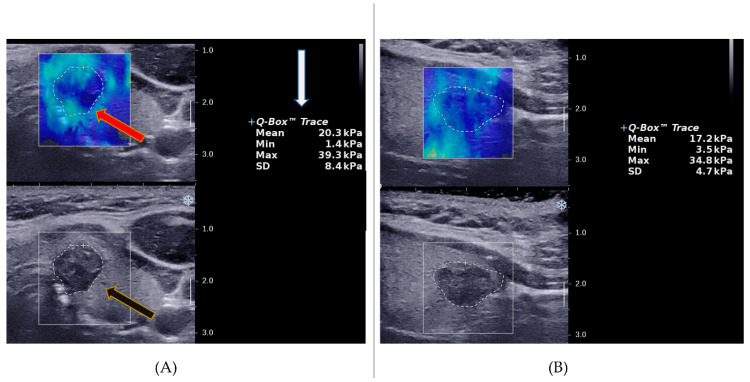
Figure 1.
Image representation of the ROI selection for the quantification of stiffness in SWE. (A) An illustration of the Q-box placement and the nodule trace outline (red arrow), the output of the quantification of thyroid nodule elasticity in different SWE indices (white arrow) and the grey scale overlay image of the same nodule (black arrow) in the transverse plane. (B) The ROI trace representation and SWE quantification of the same nodule in the longitudinal plane. The scale on the right side of either image, represents the tissue depth from the point of contact of the transducer on the neck area, whereby 1.0 = 10 mm.

