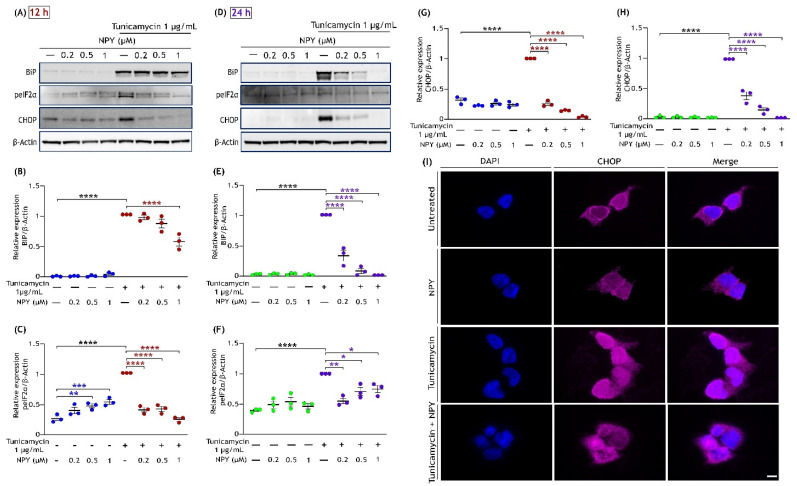
Figure 5.
NPY treatment eases the ER stress induced by tunicamycin in SH-SY5Y cells. Western immunoblot illustrates that the tunicamycin-induced activation of ER markers such as BiP, phospho-eIF2α (Ser51), and CHOP that are reduced with the NPY treatment (0.2 µM, 0.5 µM, and 1 µM) at 12 (A) and 24 h (D). Densitometric quantification of BiP at 12 (B) and 24 h (E) reveals a significant increase under tunicamycin compared to the control group (F(1,16) = 912.6 in Figure (B) and F(1,16)= 181.4 in Figure (E), **** p < 0.0001, n = 3) and a significant decrease in its expression with NPY treatment (F(3,16) = 10.72, **** p < 0.0001 represents significance between tunicamycin and tunicamycin + NPY in Figure (C) (red) and F(3,16)= 85.76, **** p < 0.0001 in Figure (E) (purple), n = 3). Densitometric quantification of phospho- eIF2α at 12 (C) and 24 h (F) reveals a significant increase under tunicamycin compared to the control group (F(1,16) = 17.33 in Figure (C) and F(1,16)= 34.16 in Figure (F), **** p < 0.0001, n = 3) and a significant decrease in its activation with NPY treatment (F(3,16) = 20.23, ** p < 0.01, *** p < 0.001 represents significance between control and NPY group (blue), **** p < 0.0001 represents significance between tunicamycin and tunicamycin + NPY in Figure (E) (red) and F(3,16)= 5.350, * p < 0.05, ** p < 0.01 in Figure (F) (purple), n = 3). Densitometric quantification of CHOP at 12 (G) and 24 h (H) reveals a significant increase under tunicamycin compared to the control group (F(1,16) = 43.85 in Figure (G) and F(1,16)= 351.1 in Figure (H), **** p < 0.0001, n = 3) and a significant decrease in its expression with NPY treatment at 12 h and 24 h, respectively (F(3,16) = 243.6, **** p < 0.0001 represents significance between tunicamycin and tunicamycin + NPY in Figure (G) (red) and F(3,16)= 129.5, **** p < 0.0001 in Figure (H) (purple), n = 3). Each band intensity was normalized to the respective band intensity of β-actin. (I) Immunofluorescence images (representative) of treated SH-SY5Y cells showing the expression of CHOP. After 12 h of treatment, cells were fixed and immunostained with an anti-CHOP antibody (pink). Nuclei were stained with DAPI (blue). Scale bar = 10 μm.

