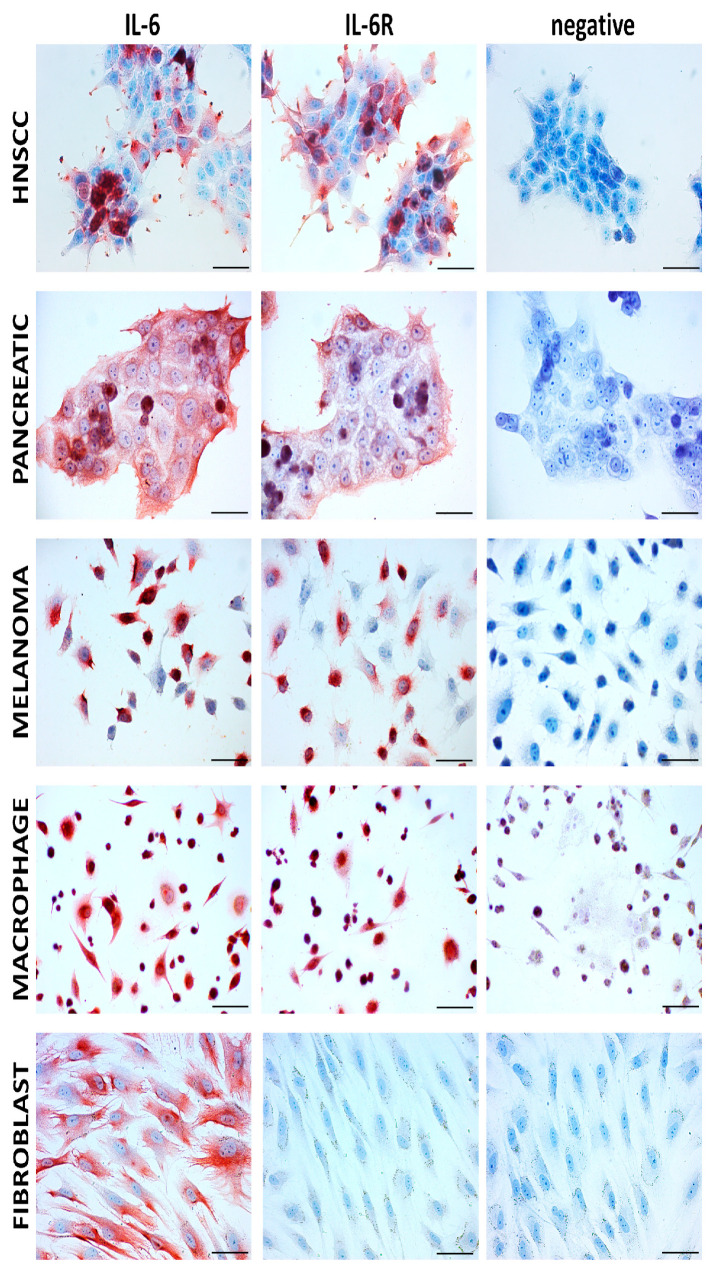
Figure 2.
Immunocytochemical analysis of IL-6 and IL-6 receptor in cell lines representing the malignant (several types) and the stromal component of tumours using immunoperoxidase reaction; positive staining is visualised by red AEC (3-amino-9-ethylcarbazole) substrate deposition. HNSCC–head and neck squamous cell carcinoma–cell line FaDu (CVCL_1218), pancreatic ductal carcinoma cell line PaTu n (CVCL_1846), melanoma cell line BLM (CVCL_7035). Macrophages were obtained by the standard protocol using the THP-1 monocytic cell line (CVCL_0006). Fibroblasts represented here are primary human isolates of dermal origin. Negative control was performed using isotype control. Gill’s haematoxylin (blue) was used for counterstaining. The bar represents 100 μm.

