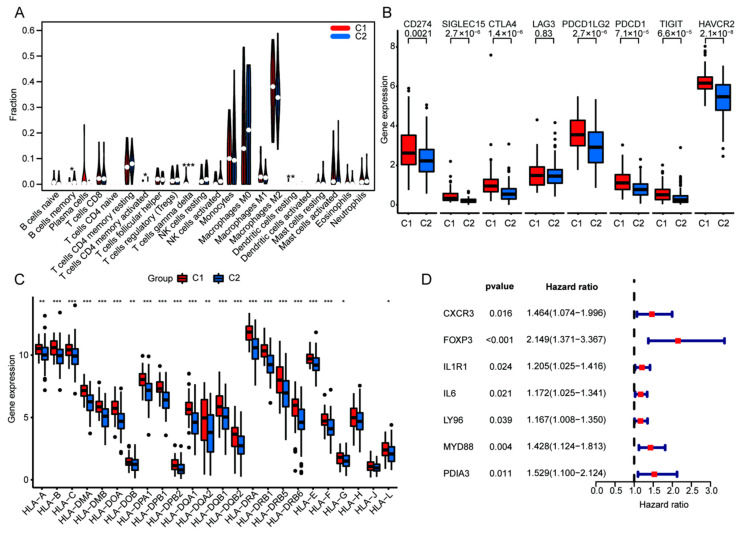
Figure 5.
Comparison of TIME in ICD genotyping and revelation of the seven ICD genes with potential prognostic value. (A) Violin plot of immune cells in C1 and C2 group. Box plots of immune checkpoints (B) and HLA genes (C). (D) Univariate cox analysis for the prognostic value of the seven ICD genes according to OS. (* p < 0.05, ** p < 0.01 and *** p < 0.001 vs. indicated group, dots mean discrete value).

