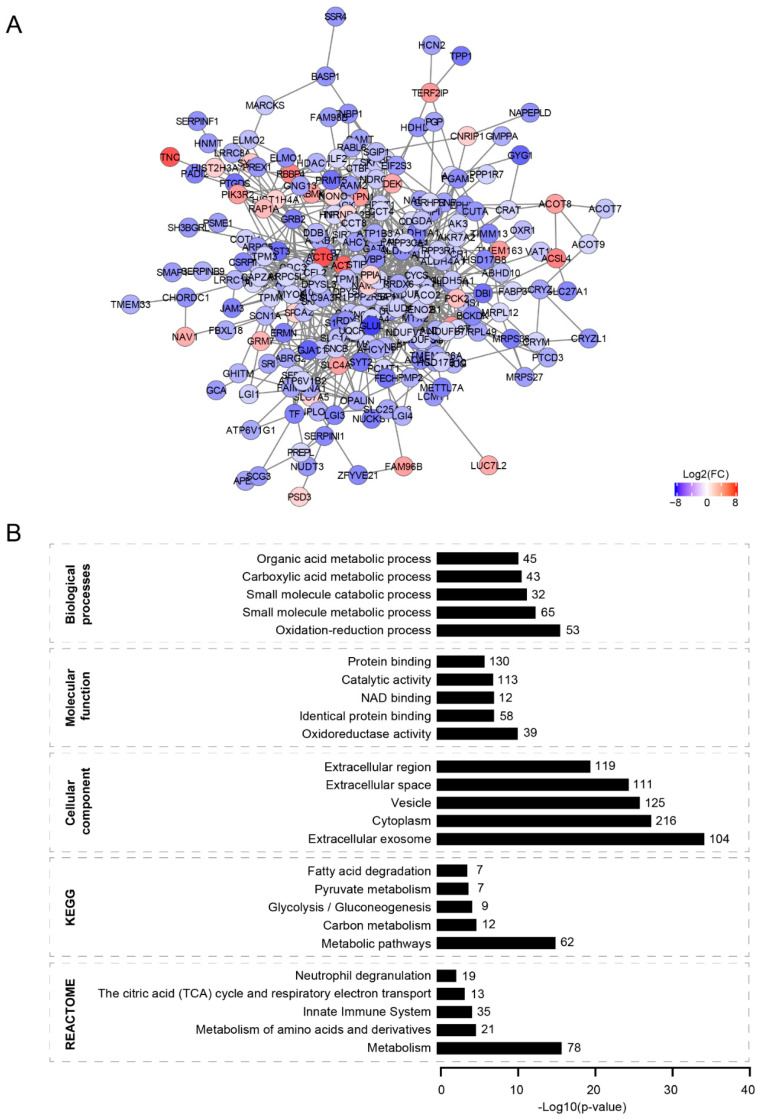
Figure 2.
Protein–protein interaction network of differentially expressed proteins in VWM cortex compared to control cortex. (A) Protein–protein network of differentially expressed proteins in VWM cortex. The network consists of a single major component (largest subnetwork), harboring 234 of the differentially expressed proteins we identified. For visualization, only clusters with more than 4 nodes are shown. Red and blue nodes indicate upregulated and downregulated proteins, respectively. (B) Gene ontologies analysis of proteins clustered in the largest subnetwork. Graphs show the top 5 enriched terms (ranked by −log10 (p-value)) for each gene ontology. The number of proteins in each term is listed.

